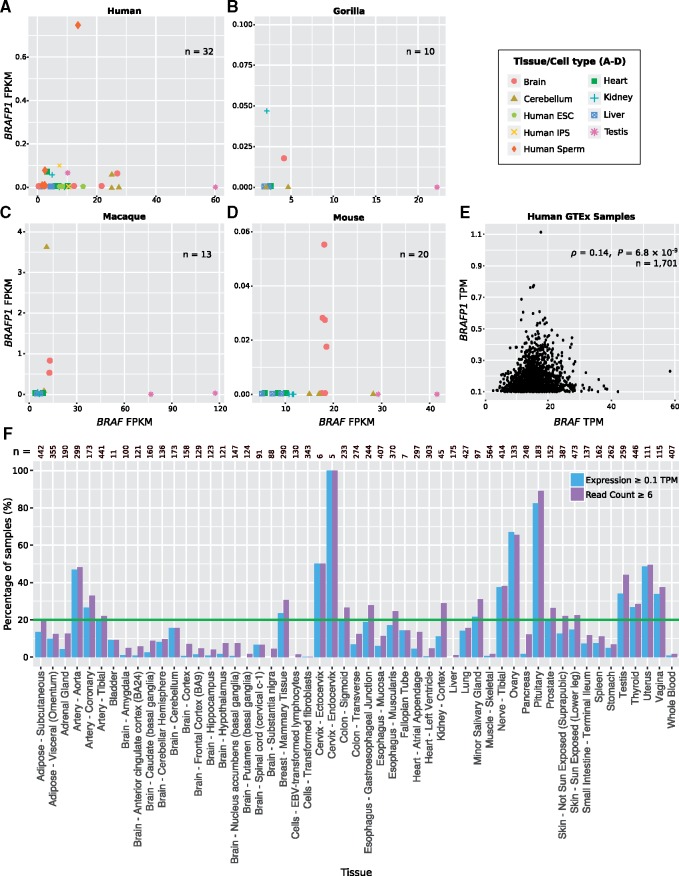
Fig. 3.
Expression of BRAF and BRAFP1 in primates and mouse. (A–D) BRAFP1 fragments per kilobase per million mapped reads (FPKM) levels are plotted against BRAF FPKM on a per sample basis. Number of samples for each species is indicated. The key (right) indicates the tissue/cell type for each sample. See Materials and Methods for RNA-seq data sources. (E) BRAFP1 TPM against BRAF TPM levels are shown for each sample available from GTEx where BRAFP1 expression is ≥0.1 TPM (n = 1,701). Samples all originate from somatic tissues. P-value is calculated by Spearman rank-order correlation test. (F) The percentage of GTEx samples in each tissue where BRAFP1 expression is ≥0.1 TPM with ≥6 reads aligning to the pseudogene is shown. The green line at 20% indicates the threshold for expression according to GTEx criteria. The total numbers of samples from each tissue are indicated.

