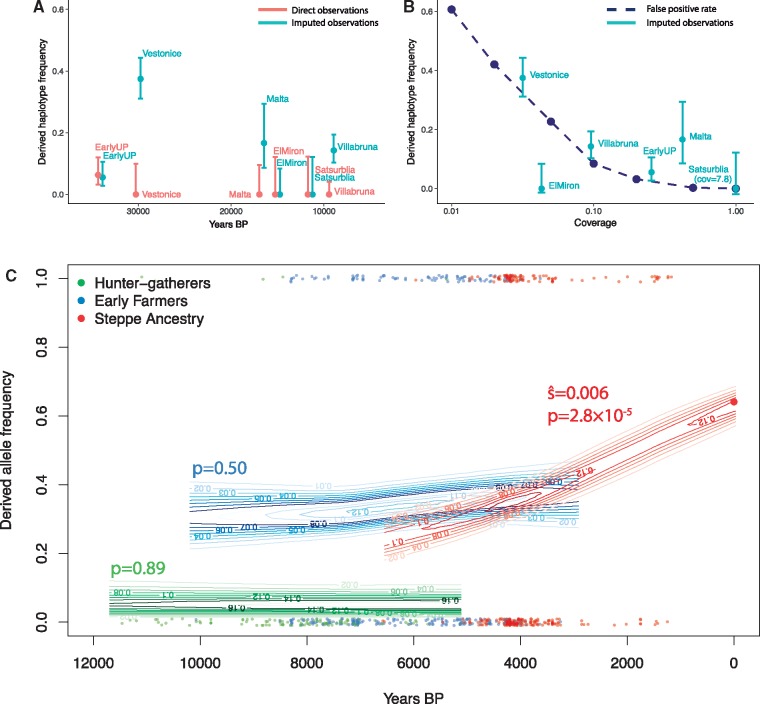
Fig. 2.
Direct ancient DNA evidence for the history of FADS1. (A) Derived haplotype frequency estimated from direct observation of SNPs on the haplotype (red) and imputed data (blue) in Upper Palaeolithic individuals (45,000–10,000 BP; Fu et al. 2016). (B) Estimated imputation false positive rate as a function of coverage (dashed line). Imputed allele frequencies in Upper Palaeolithic populations plotted for comparison at the median coverage in that population. (C) Allele frequencies at rs174546 over the past 12,000 years estimated from 1,055 (669 with coverage) ancient and 99 modern individuals. Each point is an ancient pseudo-haploid individual call, at the bottom of the plot if it is ancestral and the top if it derived. Contours indicate the posterior probability of allele frequencies in the ancient populations and P-values for nonzero selection coefficients are indicated.

