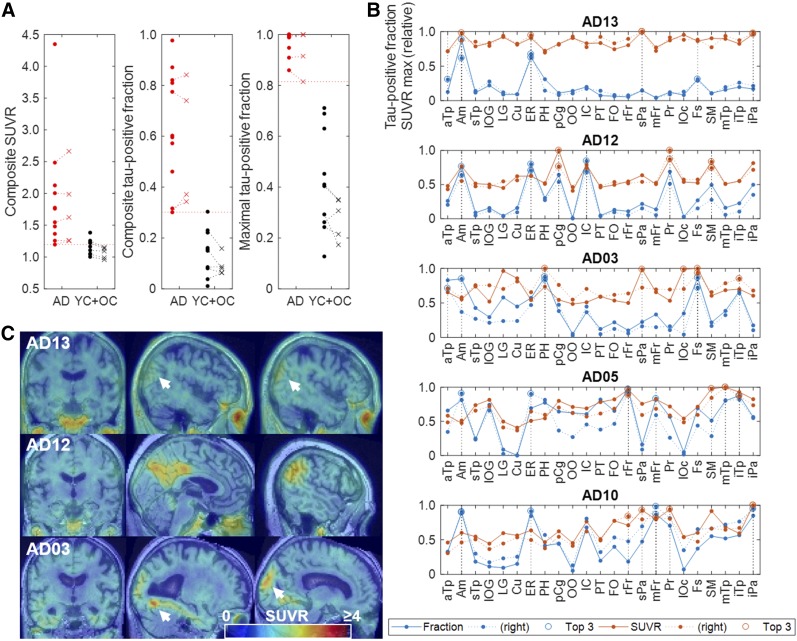
FIGURE 7.
(A) Scatterplots of composite SUVR and TPFs, and maximal tau-positive fractions of individual subjects in baseline (dots) and retest (x) scans of AD and OC + YC subjects. (B) Line plots of TPRs and maximal SUVRs of individual regions (showing highest 23 regions alone) for 5 subjects who showed lowest composite SUVR and TPRs. Three regions (per side of brain) that had highest TPF or relative SUVRs are separately shown by circles and denoted in key as Top 3. (C) SUVR images of 3 mildest cases showing locations where maximal SUVRs were observed. Key to abbreviated brain regions is in Table 2.

