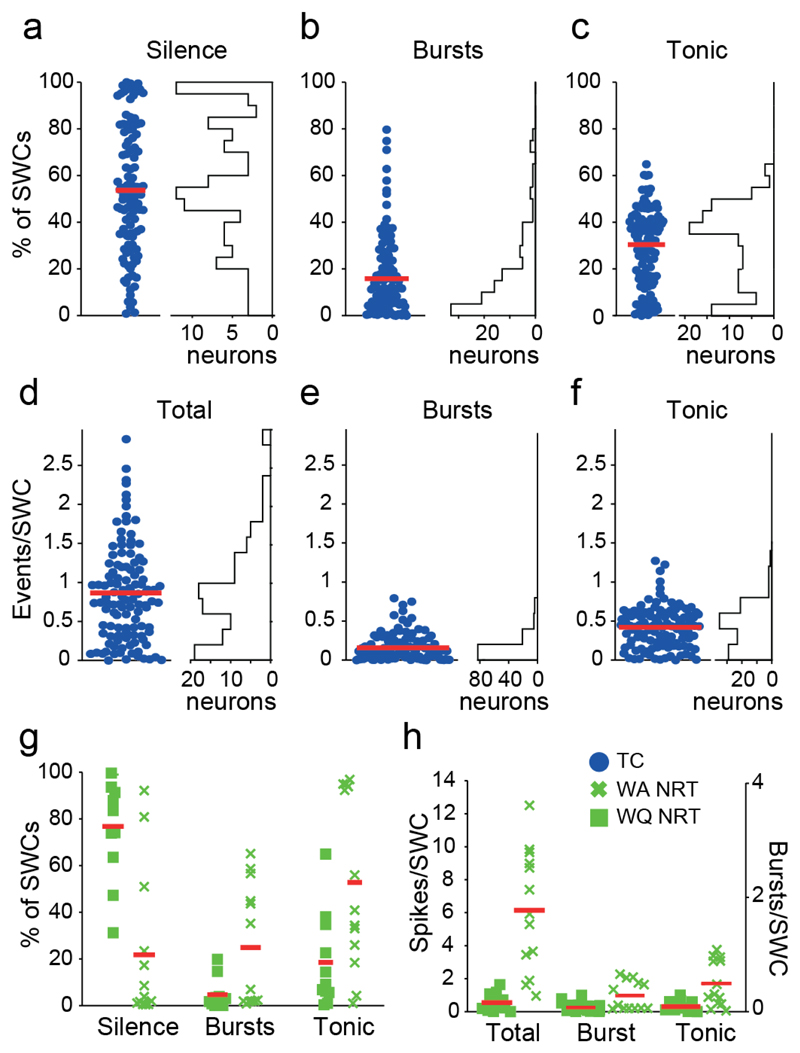
Figure 3. Ictal firing properties during ASs in GAERS.
(a,b,c) Electrical silence (a), bursts (b) and tonic (c) firing observed at each SWCs are plotted as percentage of SWCs for each TC neuron (left) and as distribution for the TC neuron population (right) (n=139). Twelve (9%) TC neurons were completely silent during ASs and 62 (45%) were silent for >50% of SWCs. Moreover, 33 (24%) TC neurons showed no burst during ASs, 84 (61%) neurons exhibited bursts for <20% of SWCs and no TC neuron had bursts for >80% of SWCs. (d,e,f) Number of events per SWC for total (d), bursts (e) and tonic firing (f) are plotted for each TC neuron (left) and as a distributions for the TC neuron population (right) (n=139 neurons). (g) Same plots as in a-c for WA and WQ NRT neurons. (h) Same plots as in d-e for WA and WQ NRT neurons. Red lines in a-h indicate mean values.

