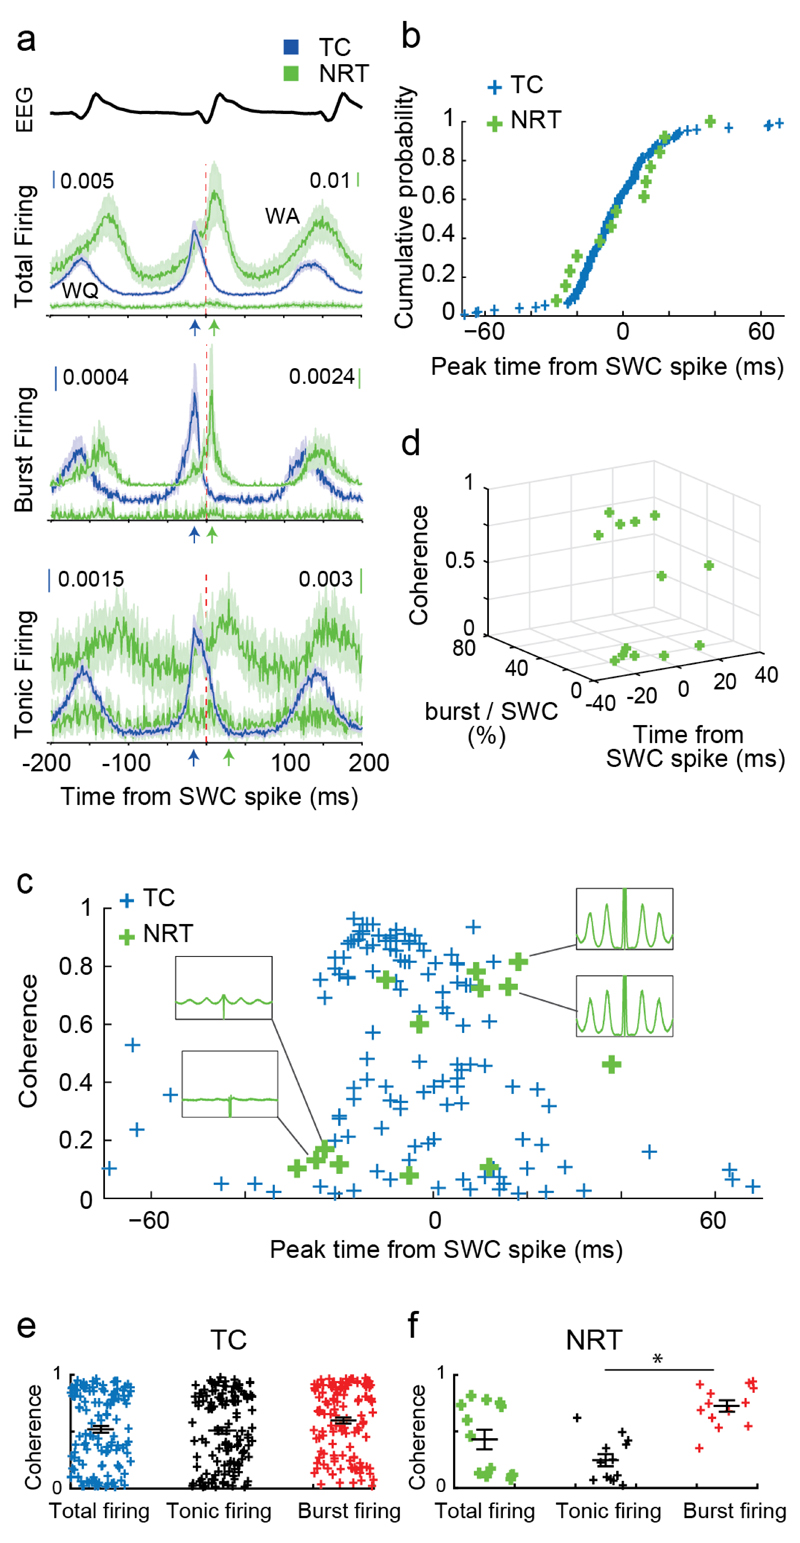
Figure 4. Synchrony and coherence of TC and NRT neuron firing during ASs.
(a) SWC-spike-triggered averages (lines: mean; shaded areas: ±SEM) of total, burst and tonic firing for GAERS TC (n=139 in all subfigures), WA (n=13 in all subfigures) and WQ (n=12) NRT neurons. Note the different peak times (color-coded arrows) of TC and NRT neurons relative to SWC spike (red vertical line). (b) Cumulative probability distributions of peak time of total firing for individual TC (blue) and WA NRT (green) neurons show no statistical difference between the two neuronal populations (p=0.631; Kolmogorov-Smirnov test). (c) SWC coherence of total firing vs peak time of total firing for individual GAERS TC and WA NRT neurons. Note the high coherence for TC neurons with peak firing times between -20 to 0 ms. In contrast, NRT neurons show low coherence (and flat autocorrelograms, left green insets) when their firing peaks occur in the -20 to 0 ms interval but high coherence (and clear peaks in the autocorrelograms, right green insets) when their firing peaks is after 0 ms. (d) 3D-plot showing NRT neurons with high coherence have a relatively high burst rate and fire relatively late with respect to the SWC-spike, while those NRT neurons with low coherence have a relatively low burst rate and fire early with respect to the SWC spike. (e) SWC coherence for different firing types (mean ± SEM in black) for individual TC (e) and NRT (f) neurons. Note the higher coherence of burst vs tonic firing in NRT neurons (*p=7x10⁻⁵, n=13 neurons, two-sided signed rank test).

