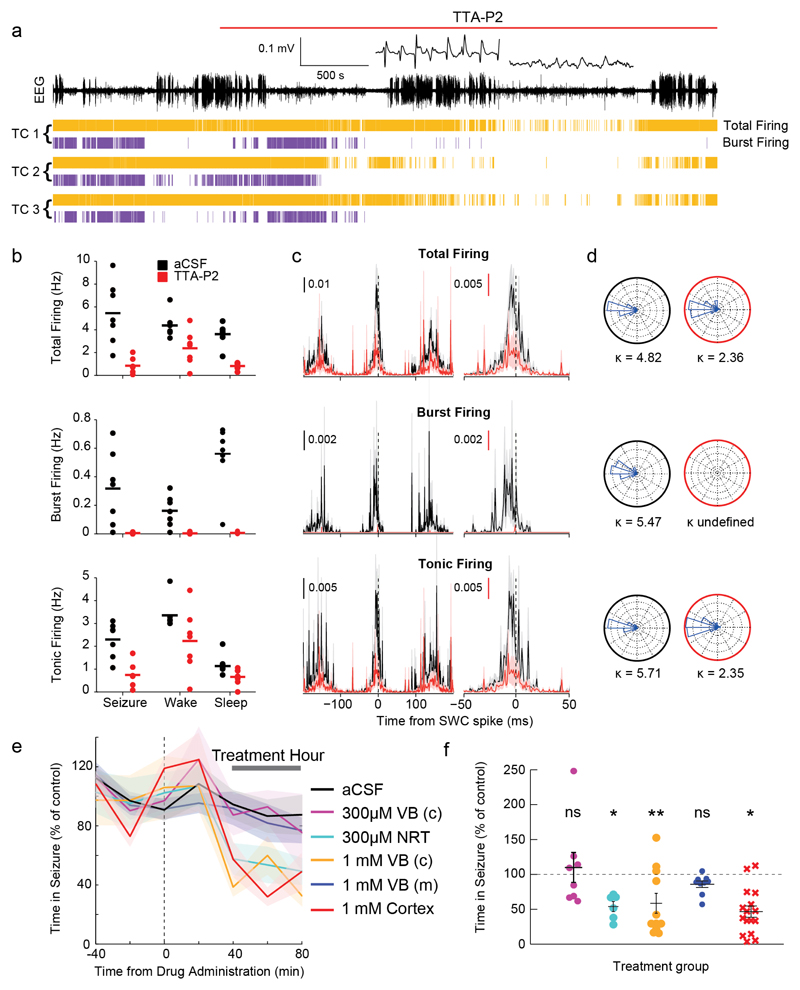
Figure 7. Block of T-channels in NRT and S1pO cortex markedly reduces ASs whereas block in TC neurons does not affect thalamic output synchrony or behavioural ASs.
(a) EEG (top trace), and spike-time (yellow) and burst-time (violet) raster plots (bottom traces) from 3 simultaneously recorded TC neurons in GAERS VB before and during reverse microdialysis administration of 300μM TTA-P2 (marked by red line) from an adjacent microdialysis probe. Note the complete block of bursts by TTA-P2 during both ASs and sleep periods (enlarged left and right trace, respectively, at the top of the EEG record). (b) Rates of different firing types before (black) and during (red) complete block of bursts by TTA-P2 show decrease in total (p=0.014), burst (p=0.015), and tonic (p=0.031) firing during ASs, and in total (p=0.031) and burst (p=0.015) but not tonic (p=0.16) firing during wakefulness (paired two-sided Wilcoxon signed-rank test). Horizontal lines indicate the mean of n=7 TC neurons. (c) SWC-triggered means of different firing types (total, burst, tonic) of n=7 TC neurons show clear peaks near the EEG SWC spike (indicated by the vertical black dashed line) before (black) and during (red) complete block of bursts by TTA-P2. Error bars (shaded areas) indicate ±SEM. (d) Circular firing distribution and circular concentration coefficient (κ) showing similar value before (black circles) and during TTA-P2 (red circles) administration (n=7 independent neurons, Kuiper test, p=0.024; κ undefined for burst firing during TTA-P2 dialysis since bursts were completely abolished). (e) Time-course of total time in seizure before and during bilateral thalamic reverse microdialysis of aCSF or different concentrations of TTA-P2 in GAERS (lines and shaded areas: mean ± SEM; Treatment Hour indicates the period analysed in (f). Black dashed vertical line indicates the start of TTA-P2 dialysis. n=8 GAERS with 300μM TTA-P2 in the centre of the VB (VB(c)), 11 with 1mM TTA-P2 in VB(c), 6 with 300μM in NRT, 9 with TTA-P2 medially to the centre of the VB (VB(m)) and 16 with 1 mM TTA-P2 in S1pO cortex. Note that microdialysis of 1mM TTA-P2 in VB(c) blocks bursts both in VB and NRT28. (f) Mean total time spent in seizure by GAERS during different TTA-P2 applications (n as in (e)) was calculated during the treatment hour as percentage of the control hour (prior to TTA-P2 administration) (color-code as in e; black horizontal lines: mean (±SEM), p=0.7422, 0.0313, 0.0186, 0.7344, 0.0182, paired two-sided Wilcoxon signed-rank test). The effect of TTA-P2 on number and duration of ASs, and on SWD frequency is illustrated in Supplementary Fig. 12.

