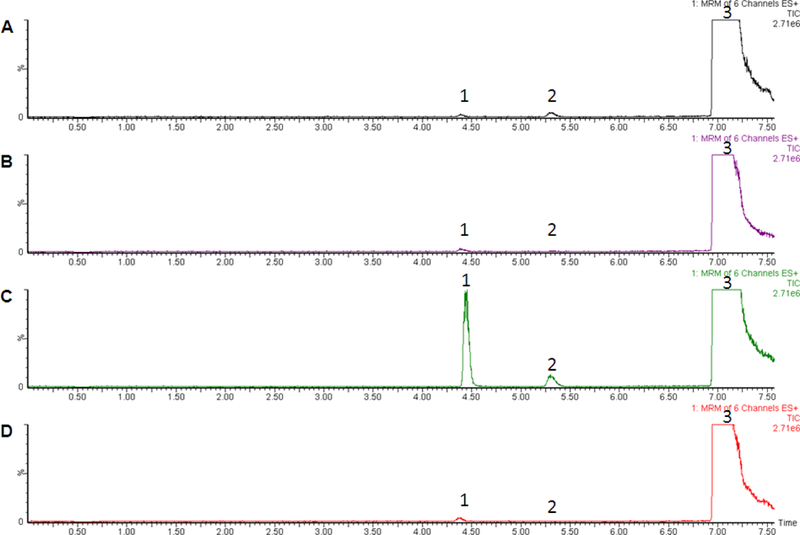
Figure 3. MRM analysis of UGT-over-expressing cell lines.

Glucuronidation assays were performed using 20 μg HLM protein or 1 mg UGT-over-expressing cell lines and incubated at 37°C for 2 h with 4 mM UDP-glucuronic acid prior to analysis by MS for MRM analysis as described in the Materials and Methods. Panel A, UGT1A1 + CLZ; panel B, UGT1A3 + CLZ; panel C, UGT1A4 + CLZ; panel D, UGT2B10 + CLZ. Peak 1, CLZ-5-N-glucuronide; peak 2, CLZ-N+-glucuronide; peak 3, CLZ. Y-axis = signal intensity; x-axis = retention time (min).
