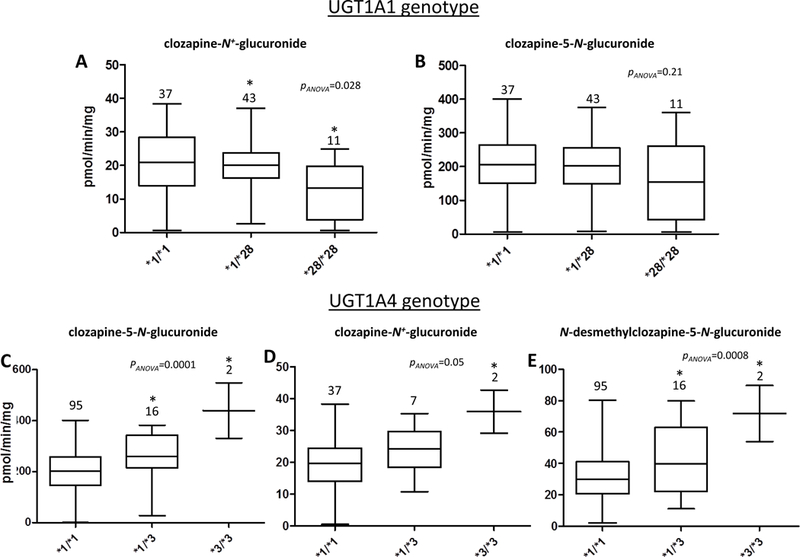
Figure 5. HLM activity stratified by UGT genotypes.

Shown are box and whisker plots of the levels of CLZ-5-N-glucuronide, CLZ-N+-glucuronide, and dmCLZ-5-N-glucuronide formation versus UGT1A1 or UGT1A4 genotypes in HLM. Glucuronidation activity assays were performed using 160 μM CLZ or 320 μM dmCLZ and 12.5 μg of HLM protein, and CLZ or dmCLZ glucuronides were detected and separated by UPLC as described in the Materials and Methods. Using genomic DNA from the same liver specimens for which HLM were prepared, UGT1A1 and UGT1A4 genotypes were determined by DNA sequencing. Panels A-B, CLZ glucuronidation in HLM stratified by UGT1A1 genotypes; panels C-E, CLZ and dmCLZ glucuronidation in HLM stratified by UGT1A4 genotypes. Panel A and D, CLZ-N+-glucuronide formation; panels B and C, CLZ-5-N-glucuronide formation; panel E, dmCLZ-5-N-glucuronide formation. Analysis of CLZ glucuronidation in HLM stratified by UGT1A1 genotypes was performed only for those specimens also exhibiting the wild-type UGT1A4 (*1/*1) genotype (n=94). Analysis of CLZ and dmCLZ glucuronidation in HLM stratified by UGT1A4 genotypes was performed only for those specimens also exhibiting the wild-type UGT1A1 (*1/*1) genotype (n=49) for CLZ-N+-glucuronide formation. All HLM (n=113) were used for analysis of CLZ-5-N-glucuronide and dmCLZ-5-N-glucuronide formation. Whiskers = min and max; horizontal line = median. Statistical analysis was performed using ANOVA, with *=p<0.05 using Tukey’s post-hoc correction for comparison of HLM with variant genotypes with the corresponding wild-type (*1/*1) HLM group.
