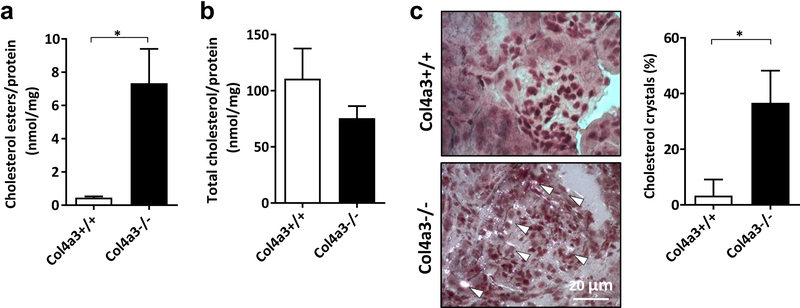
Figure 1. Cholesterol accumulation in kidney cortexes of Col4a3 knockout mice.
(A) Bar graph analysis showing significant accumulation of cholesterol esters in kidney cortexes of Col4a3 knockout mice compared to wildtype controls. *p<0.05, t-test. (B) No changes in total cholesterol levels are detected in kidney cortexes between Col4a3 knockout mice and wildtype littermates. *p<0.05, t-test. (C) Cholesterol crystal staining of kidney sections and bar graph analysis reveal significant cholesterol crystals accumulation (white arrows) in Col4a3 knockout mice (Col4a3−/−) when compared to wildtype littermates (Col4a3+/+). Bars are 20μm. *p<0.05, t-test. All data are presented as mean ± SD.

