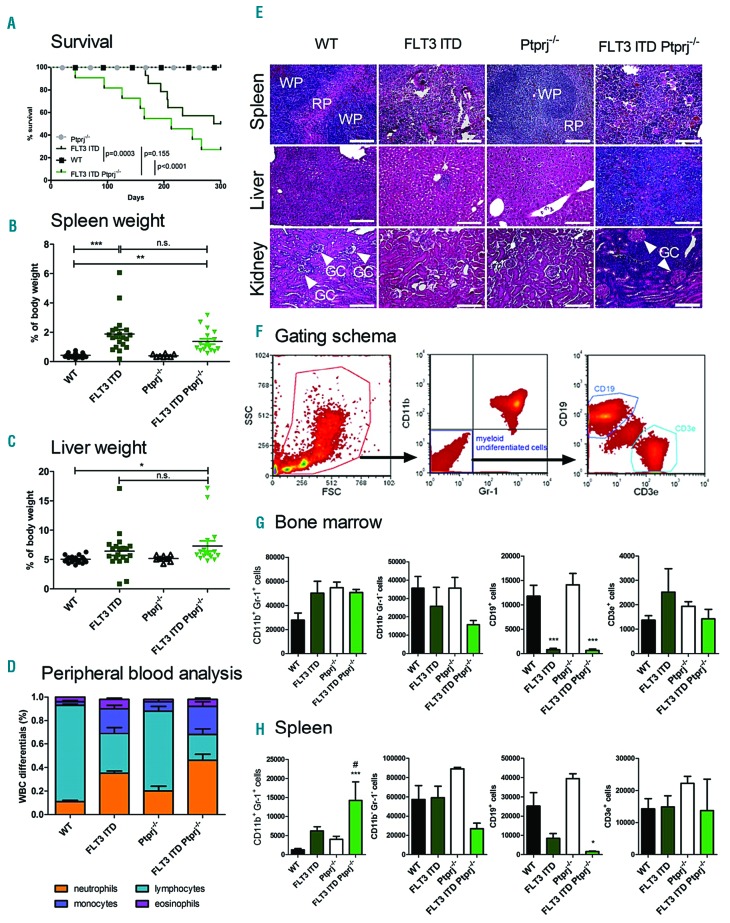
Figure 2.
The inactivation of Ptprj results in enhanced myeloproliferation in FLT3ITD/ITD mice. (A) Kaplan-Meier survival curves of FLT3ITD/ITD Ptprj−/− and age-matched litter mates. The P values of the log rank test are indicated. The spleen (B) and liver (C) weight (normalized to total body weight) of 30 to 35-week-old WT, FLT3ITD/ITD, Ptprj−/− and FLT3ITD/ITD Ptprj−/− mice. *P<0.05, **P<0.01, ***P<0.001 compared to WT mice. (D) White blood cell count (WBC) differentials of peripheral blood. WBC differentials are shown in mean ± SEM for FLT3ITD/ITD Ptprj−/− mice and controls from 30 to 35-week-old mice and indicate a reduced lymphocyte and increased neutrophil and monocyte population in Ptprj−/−FLT3ITD/ITD mice compared to FLT3ITD/ITD mice. (E) H&E histopathology showing spleen (top), liver (middle) and kidney (bottom) architecture from 30-to 35-week-old WT, FLT3ITD/ITD, Ptprj−/− and FLT3ITD/ITD Ptprj−/− mice (WP: white pulpa; RP: red pulpa; GC, glomerula capsule with arrows); bars indicate 100 μm. (F-H) Immunophenotype of the BM and spleen cells from FLT3ITD/ITD Ptprj−/− mice show an expansion of the granulocyte/monocyte population and lack of B cells. 30 to 35-week-old mice were analyzed. (F) Gating schema for the characterization of myeloid undifferentiated B and T cells (G) Graphical presentation of CD11b/Gr-1 expression in the BM (G) or spleen (H) and CD19/CD3e expression in the CD11b−/Gr-1− population as the total cell number out of 106 analyzed cells. Values are given as mean ± SEM; *P<0.05, **P<0.01, ***P<0.001 compared to WT; #P<0.05compared to FLT3ITD/ITD. n.s: not significant; WT: wild-type.

