Figure 3.
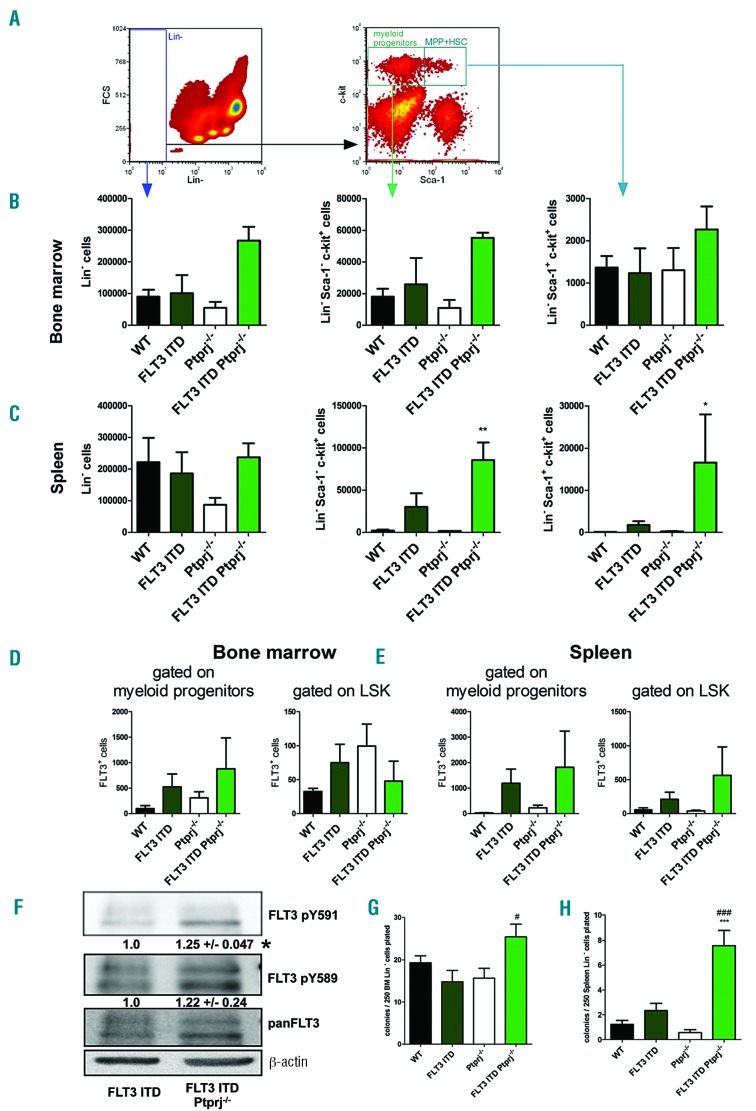
The inactivation of Ptprj in FLT3ITD/ITD mice affects the formation of progenitor cells. Lineage analysis of the BM and spleen cells from FLT3ITD/ITD Ptprj−/− mice shows an expansion of the Lin− c-kit+ Sca-1− and Lin− c-kit+ Sca-1+ population and amount of FLT3+ cells. Representative flow cytometric analysis of the BM or spleen cells derived from WT, FLT3ITD/ITD, Ptprj−/− and FLT3ITD/ITD Ptprj−/− mice are shown. (A) Dot plots illustrating the gating for Lin−, Lin− c-kit+ Sca-1− and LSK (Lin-c-kit+ Sca-1+) cell populations. An abundance of these cells in the BM (B) and spleen (C) is presented. Values are given as mean ± SEM; *P<0.05, **P<0.01, compared to WT. (D, E) The number of FLT3 positive cells of myeloid progenitors (Lin-c-kit+ Sca-1−, left) or LSK cell (right) derived from the BM (D) or spleen (E). (F) FLT3ITD/ITD Ptprj−/− mice show enhanced FLT3-ITD activity. Western blotting of the Lin-BM cells of 30-week-old FLT3ITD/ITD and FLT3ITD/ITD Ptprj−/− mice. BM cells were MACS-purified for Lin-immunophenotype. Cells were lysed, processed via sodium dodecyl sulfate polyacrylamide gel electrophoresis (SDS-PAGE) and subsequently underwent immunoblotting using phospho site specific antibodies which recognized FLT3 pY591 and FLT3 pY589. Each blot was reprobed for panFLT3 antibodies and β-actin was used as the loading control. A representative blot is presented. Numbers under the phosphor-specific blots (mean +/-SEM) represent the quantification of the phosphor-specific signals of three independent experiments, normalized to the corresponding signals with pan-specific antibodies, and relative to the signals in FLT3 ITD mice, which was set to 1.0. *P<0.05. (G, H) The promotion of clonogenic growth of Lin-FLT3ITD/ITD Ptprj−/− spleen cells. Lin-BM (G) and spleen (H) cells from 30 to 35-week-old WT, FLT3ITD/ITD, Ptprj−/− and FLT3ITD/ITD Ptprj−/− mice were plated on M3434 methylcellulose medium (containing stem cell factor [SCF-1], interleukin-3 [IL-3], erythropoietin [EPO]) and scored for colony formation seven days later. ***P<0.001 compared to WT;#P<0.05; ###P<0.001 compared to FLT3ITD/ITD mice. WT: wild-type.

