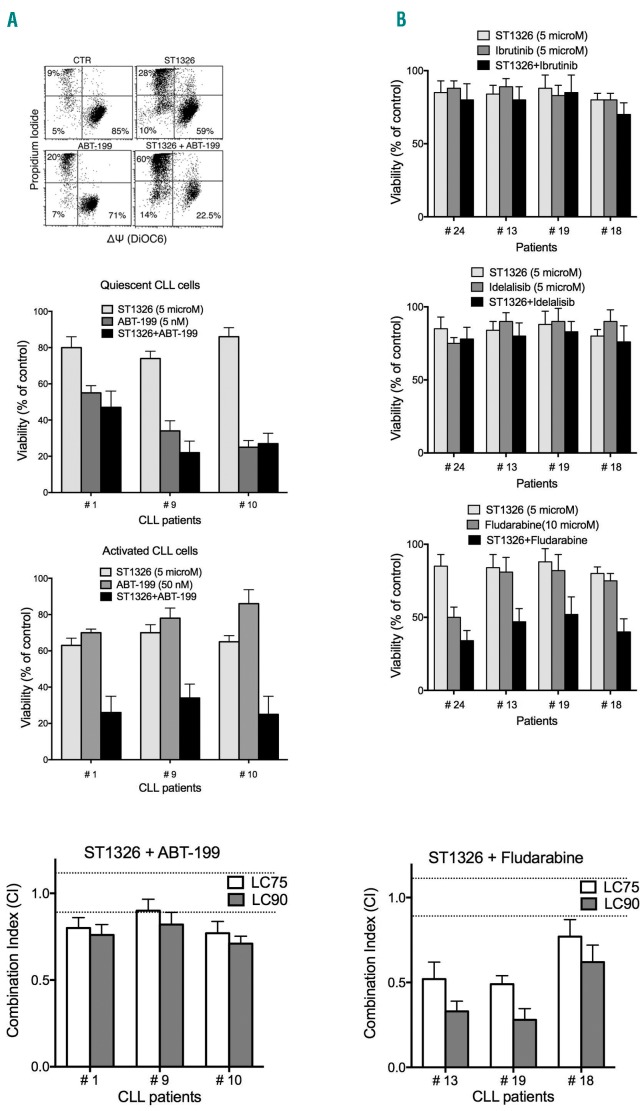
Figure 3.
ST1326 potentiates cytotoxicity of drugs that lose effectiveness when chronic lymphocytic leukemia cells proliferate. (A) Upper: flow cytometric bivariate plots of mitochondrial transmembrane potential (ΔΨ) (DiOC6 fluorescence) and cell viability (propidium iodide exclusion) of leukemic cells from one representative CLL patient stimulated with CD40L+IL-4 and cultured with ST1326 (10 μM), ABT-199 (10 μM), or both drugs for 42 h. Middle: ST1326 and/or ABT-199 cytotoxicity (42 h) on unstimulated (Quiescent) and CD40L-stimulated (Activated) CLL cultures. Given that ABT-199 loses efficacy on activated/proliferating leukemic cells, the drug concentration was 10 times higher in stimulated cultures. Only stimulated CLL cells displayed increased sensitivity to drug combinations, if compared to either drug alone. Lower: combination index (CI) values (at LC75 and LC90) calculated using the Chou–Talalay model (CalcuSyn software, Biosoft, Cambridge, UK) on dose-effect profiles of activated CLL cells treated for 24 h with increasing concentrations of ST1326 (1–10 μM), ABT-199 (10–100 nM) or ST1326/ABT-199 at constant ratios. Since the CI depends on the ‘fractional effect level’, we report two levels of cytotoxicity, LC75 and LC90 (concentration lethal to 75% and 90% of CLL cells, respectively). Dotted lines indicate CI=0.9 and CI=1.1; Synergism = CI<0.9, additive effect = 0.9≤CI≤1.1 and antagonism = CI>1.1. The original CI curve and isobolograms are reported in Online Supplementary Figure S5. (B) Upper three insets: cytotoxicity of the combination of ST1326 (5 μM) and ibrutinib (5 μM), idelalisib (5 μM) or fludarabine (10 μM), administered for 24 h to activated CLL samples. Lower: CI values (at LC75 and LC90) calculated using the Chou–Talalay model on dose-effect profiles of activated CLL cells treated for 24 h with increasing concentrations of ST1326 (1–20 μM), fludarabine (1–30 μM) or ST1326/fludarabine at constant ratios.

