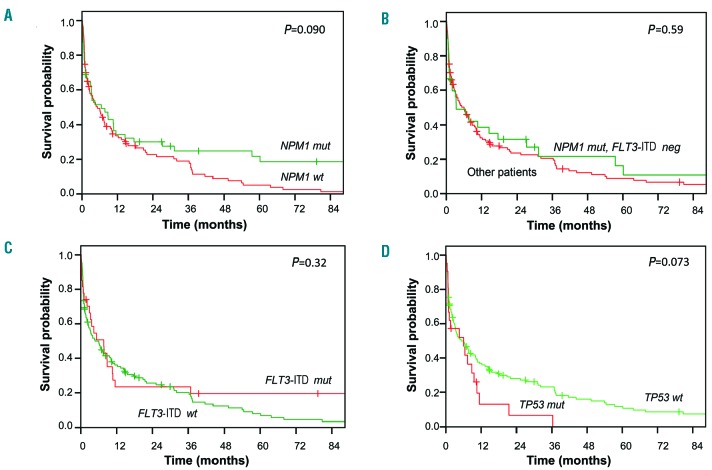
Figure 3.
Overall survival according to gene mutations. (A) NPM1 mutations: overall survival in NPM1-mutated (green) compared to NPM1-wildtype patients (red). (B) NPM1-mutated/FLT3-ITD-negative patients: overall survival in NPM1-mutated/FLT3-ITD-wildtype patients (green) compared to other patients (red). (C) FLT3-ITD mutations: overall survival in FLT3-ITD-mutated (red) compared to FLT3-ITD-wildtype patients (green). (D) TP53 mutations: overall survival in TP53-mutated patients (red) compared to TP53-wildtype patients (green). “Mut” denotes mutated and “wt” wildtype.

