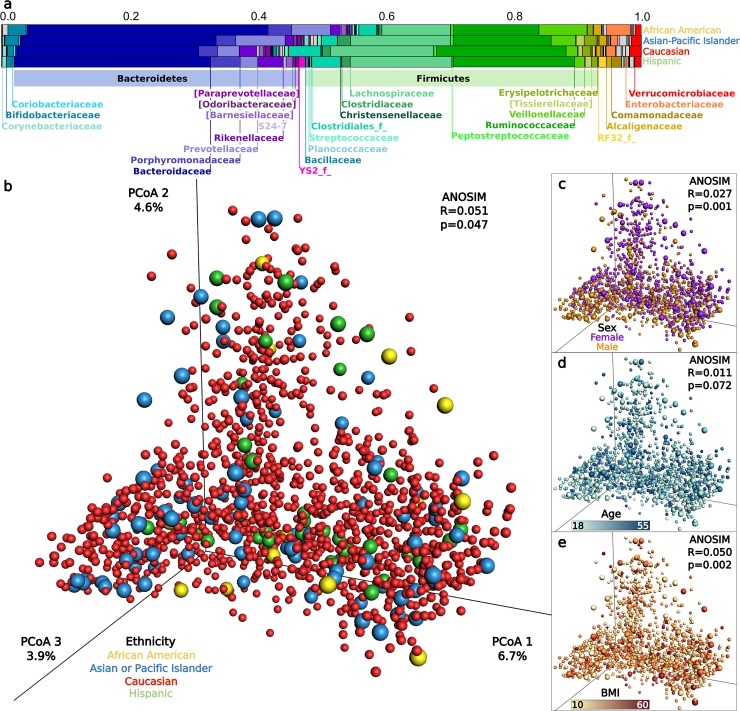
Fig 1. Gut microbiota composition and distinguishability by ethnicity, sex, age, and BMI.
(A) The average relative abundance of dominant microbial families for each ethnicity. (B–E) Principle coordinates analysis plots of microbiota Bray–Curtis beta diversity and ANOSIM distinguishability for: (B) Ethnicity, (C) Sex, (D) Age, (E) BMI. In B–E, each point represents the microbiota of a single sample, and colors reflect metadata for that sample. Caucasian points are reduced in size to allow clearer visualization, and p-values are not corrected across factors that have different underlying population distributions. Data available at https://github.com/awbrooks19/microbiota_and_ethnicity. BMI, body mass index.

