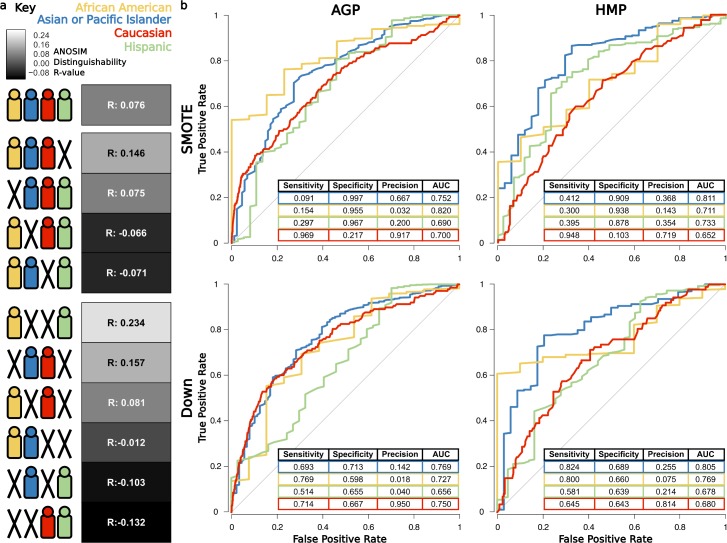
Fig 3. Microbiota distinguishability and classification ability across ethnicities.
(A) ANOSIM distinguishability between all combinations of ethnicities. Symbols depict specific ethnicities included in the ANOSIM tests, and boxes denote the R-value as a heatmap, in which white indicates increasing and black indicates decreasing distinguishability relative to the R-value with all ethnicities. (B) Average ROC curves (for 10-fold cross-validation) and prediction performance metrics for one-versus-all RF classifiers for each ethnicity, using SMOTE [33] and down subsampling approaches for training. Data available at https://github.com/awbrooks19/microbiota_and_ethnicity. ANOSIM, analysis of similarity; RF, random forest; ROC, receiver operating characteristic; SMOTE, synthetic minority oversampling technique.

