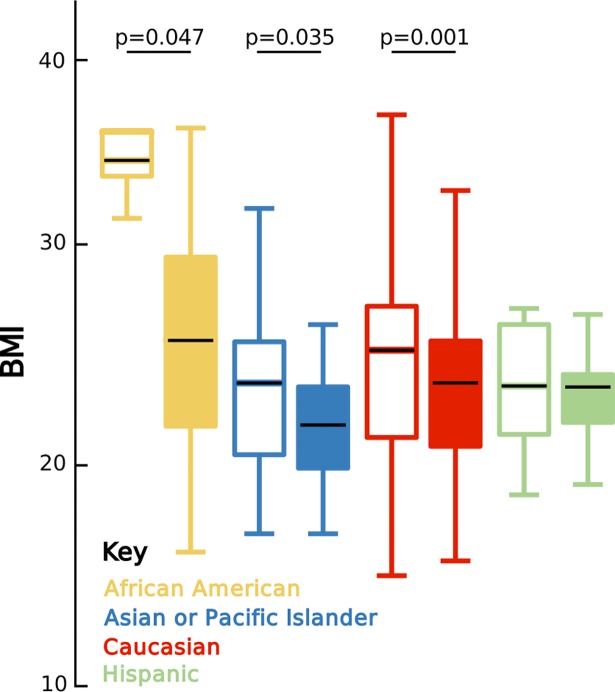
Fig 5. Christensenellaceae variably associate with BMI across ethnicities.
Boxplots of BMI for individuals without (unfilled boxplots) and with (filled boxplots) Christensenellaceae. Significance was determined using one-tailed Mann–Whitney U tests for lower continuous BMI values. Black lines indicate the mean relative abundance; the lower and upper end of each box represent the 25th and 75th percentiles, respectively; and whiskers denote the 1.5 interquartile range. Data available at https://github.com/awbrooks19/microbiota_and_ethnicity. BMI, body mass index.

