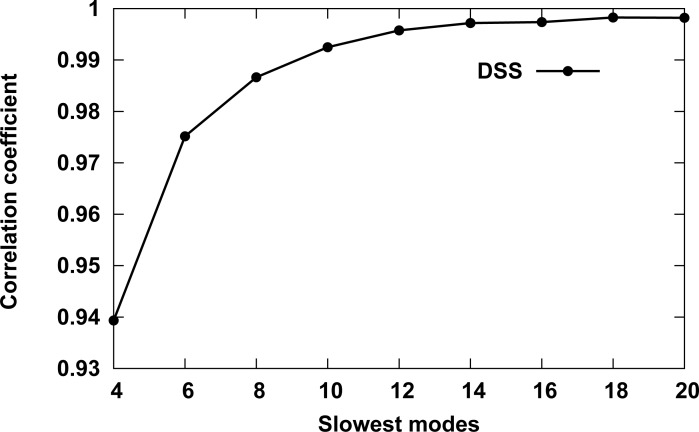
Fig 1. Correlation coefficient between DSSs calculated with different number of slow modes.
The calculations were performed for globin chains in dataset1. The first data point (Slowest modes value 4) marks the correlation coefficients between DSS scores calculated using the 2 and 4 slowest modes, with the second between DSS scores calculated using the 4 and 6 slowest modes, and so on.

