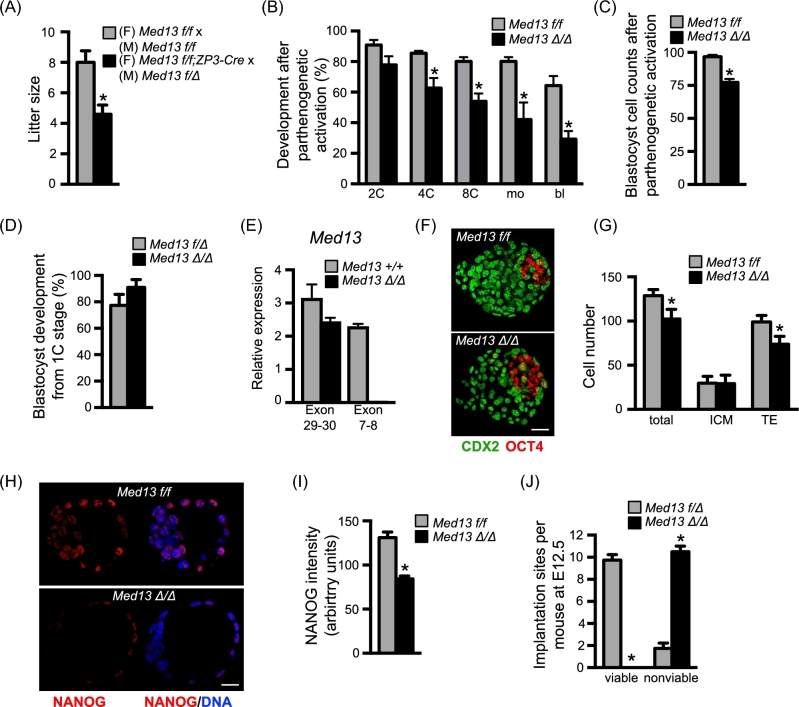
Figure 5.
Postimplantation developmental arrest of Med13 knockout embryos. (A) Average litter size from breeding pairs of indicated genotypes. N = 10 litters/group, *P < 0.05, T-test. (B) Metaphase II eggs of the indicated genotype were parthenogenetically activated and allowed to develop in vitro. Graph represents average percentage of embryos to develop to the indicated stages. N = 3, total of 51–55 1C embryos/group; P < 0.05 compared to same stage, ANOVA with Holm-Sidak multiple comparisons test. (C) Total cell numbers in parthenogenetically activated embryos of each genotype that reached the blastocyst stage. N = 27 embryos/group, *P < 0.0001, T-test. (D) In vivo fertilized, 1C-stage embryos of the indicated genotypes were collected and allowed to develop in vitro. Graph represents percentage of embryos to develop to the blastocyst stage. N = 3 breeding pairs per group, 8–13 1C embryos collected per female. (E) Relative expression of Med13 mRNA encoding exons 29–30 and 7–8. Graph shows median ± range. N = 2 replicates. (F) Representative immunofluorescent staining of blastocyst stage embryos of the indicated genotypes that developed from the 1C stage in vitro. (G) Graph of cell numbers in the blastocysts from (E). Inner cell mass (ICM), trophectoderm (TE). N = 3, total of 13–16 embryos/group; *P < 0.05, T-test. (H) Representative immunofluorescent staining of blastocyst stage embryos of the indicated genotypes that developed from the 1C stage in vitro. Red channel on left, merged image on right. (I) Graph of NANOG staining intensity in the blastocysts from (G). N = 3, total of 23–31 embryos/group; *P < 0.0001, T-test with Welch correction. (J) Females carrying oocytes with normal amounts of MED13 (Med13f/f) or lacking MED13 (Med13f/f;ZP3-Cre) were mated to males carrying sperm lacking MED13 (Med13f/Δ;Hspa2-Cre) to generate either Med13f/Δ or Med13Δ/Δ embryos. Graph shows numbers of viable and nonviable implantation sites on E12.5. N = 4 females/group; *P < 0.0001, Fisher exact test. All graphs except panel E show mean ± s.e.m. All bars = 20 μm.

