Figure 6.
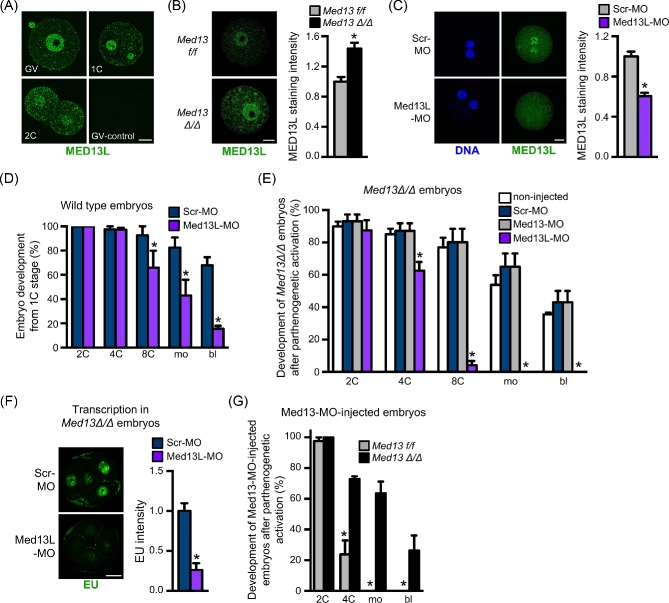
MED13L compensates for lack of MED13 during preimplantation embryo development. (A) Immunofluorescent staining of MED13L protein in wild-type GV oocytes, 1C- and 2C-stage embryos. GV-control staining done with no primary antibody. (B) Immunofluorescent staining and quantification (arbitrary units) of MED13L in GV oocytes of the indicated genotype. N = 3, total of 30/group; *P < 0.05, T-test. (C) Immunofluorescent staining and quantification (arbitrary units) of MED13L in parthenogenetically activated 1C embryos following microinjection of the indicated morpholino at the GV stage. N = 3, total of 18/group; *P < 0.05, T-test. (D) Percentage of wild-type embryos to reach the various preimplantation embryo stages following microinjection at the 1C stage with the indicated morpholino. N = 3, total of 61–70 1C embryos/group; *P < 0.05 compared to Scr-MO control at same time point, ANOVA with Holm-Sidak multiple comparisons test. (E) Percentage of embryos derived from parthenogenetically activated eggs to reach the various preimplantation embryo stages following microinjection at the 1C stage with the indicated morpholino. N = 4, 15–24 1C embryos/group for each replicate; *P < 0.05 compared to Scr-MO control at same time point, ANOVA with Holm-Sidak multiple comparisons test. (F) Representative images of Med13Δ/Δ embryos microinjected with the indicated morpholino and stained with EU at the 4C stage as an indicator of transcription levels. Graph shows quantification of staining intensity. N = 3–6 embryos/group; *P < 0.05, T-test. (G) Percentage of embryos derived from parthenogenetically activated eggs of the indicated genotypes to reach the various preimplantation embryo stages following microinjection at the 1C stage with Med13-MO. Graph represents average percentage of embryos to develop to the indicated stages. N = 3, total of 56–59 1C embryos/group; *P < 0.05 compared to same stage, ANOVA with Holm-Sidak multiple comparisons test. All graphs show mean ± s.e.m. All bars = 20 μm.

