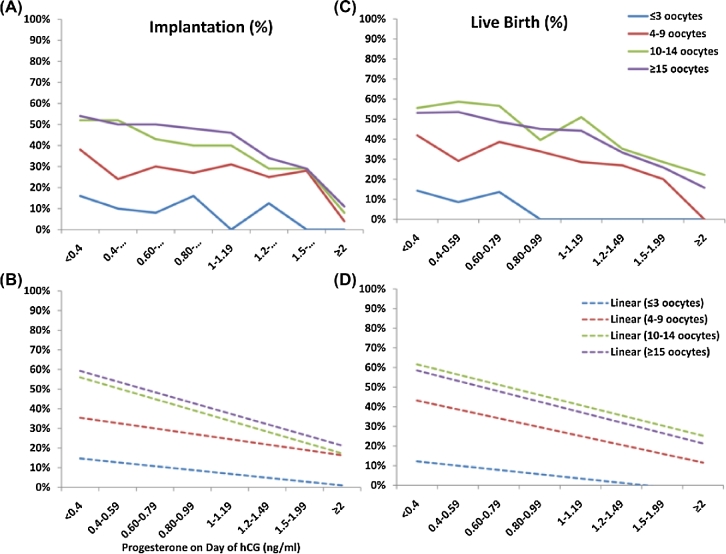
Figure 3.
Effect of serum P values on implantation and live birth based on ovarian response. P values (ng/mL) are plotted on the x-axis. Implantation and live birth are indicated on the y-axis. Actual implantation (A) and live birth (C) are shown per serum P value. Linear trend lines for implantation (B) and live birth (D) are shown per serum P value. hCG = human chorionic gonadotropin; P = progesterone. Reprinted with permission from Elsevier on 02/08/2018. Hill, MJ, et al., Are good patient and embryo characteristics protective against the negative effect of elevated progesterone level on the day of oocyte maturation? Fertil Steril 2015;103(6):1477–84.e1–5 [5].

