Figure 3.
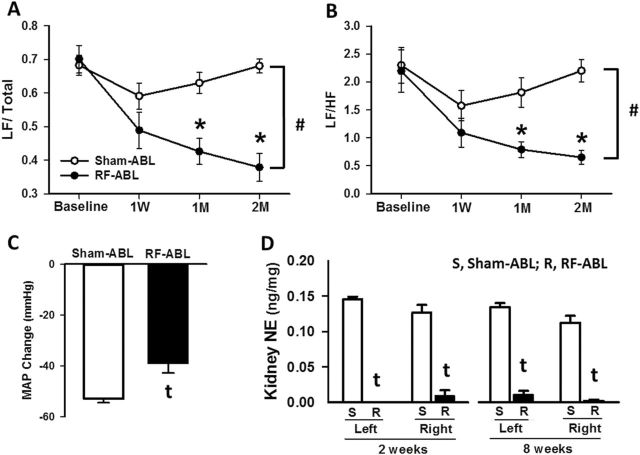
Chronic effects of RF-ABL on low and high frequency components of BPV as assessed by spectral analysis in hypertensive SHR. Values are means ± SE demonstrating changes in the frequency components of BPV expressed as (a) LF/total and (b) LF/HF at baseline, 1W, 1M, and 2M after RF-ABL or Sham-ABL. (c) MAP response to chlorisondamine (5mg/kg, i.p.) administration in SHR 8 weeks following RF-ABL or Sham-ABL (n=7/group). (D) Norepinephrine content measured in left and right kidney cortex from groups of SHR at 2 weeks (n = 5/group) and 8 weeks (n = 7/group) following Sham-ABL (S) or RF-ABL (R). Values are means ± SE. #P < 0.05, compared with Sham-ABL (2-way ANOVA, main effect); *P < 0.05, compared with Sham-ABL value at same time point (significant interaction, Bonferroni’s post hoc test). tP < 0.05, compared with Sham-ABL (Student’s t test). Abbreviations: ANOVA, analysis of variance; BPV, BP variability; DBP, diastolic blood pressure; HF, high frequency; HR, heart rate; LF, low frequency; M, month; MAP, mean arterial pressure; RF-ABL, radiofrequency ablation of the renal arteries; SBP, systolic blood pressure; SHR, spontaneously hypertensive rats; W, week.

