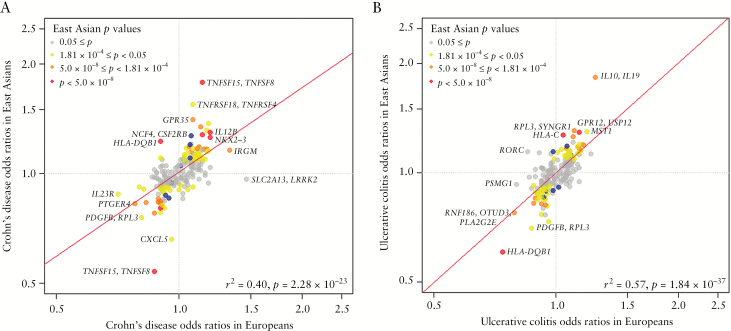
Figure 2.
Comparison of odds ratios [ORs] for the 193 reported and 7 newly identified Crohn’s disease and ulcerative colitis risk variants in Europeans and East Asians [based on the minor allele in Europeans]. The 193 reported SNPs are listed in Supplementary Table 5 and 7 newly identified SNPs in Table 1. Each dot represents the ORs [on a log scale] for each SNP in [A] Crohn’s disease and [B] ulcerative colitis. Colour denotes the range of association p values for Crohn’s disease or ulcerative colitis in the discovery dataset. The red line refers to linear regression, which was weighted by the inverse of the variance of the log[ORs] in the discovery dataset. The correlation coefficients and p values of the linear model are shown at the bottom-right corner.

