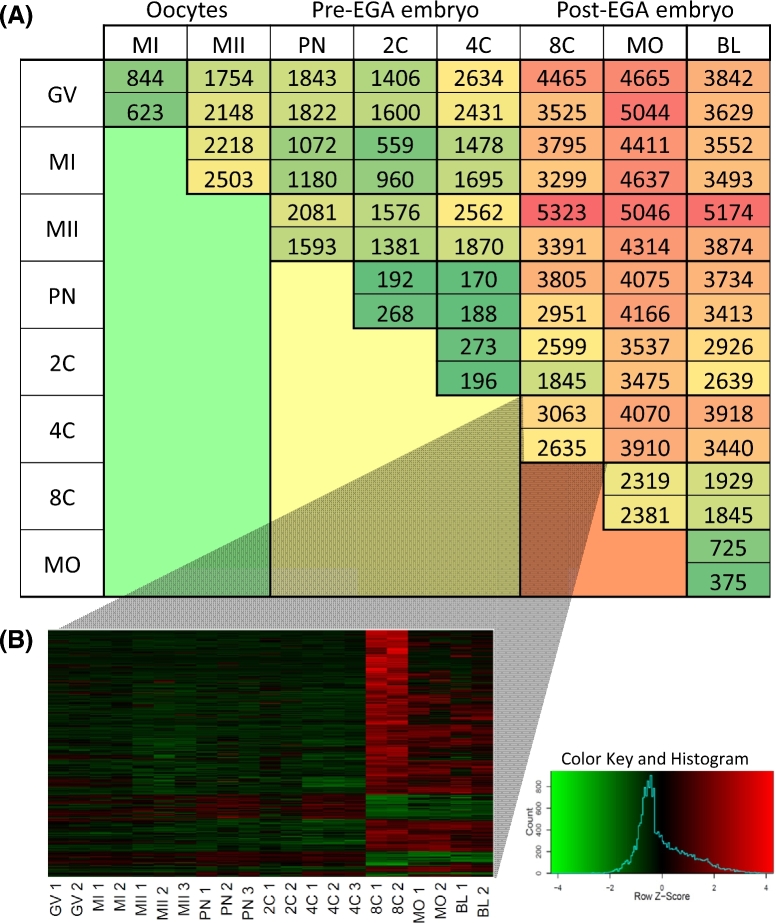
Figure 2.
DEGs between sequential developmental stages. (A) The number of DEGs between each developmental stage (adjusted P-value < 0.05) was found using DESeq2. The top and bottom cell from each comparison indicate number of up- and downregulated genes, respectively (fold change >2 or <0.5). Color gradation indicates lower (green) or higher (red) number of genes. (B) Transcript abundance in each sample of genes differentially expressed between the 4-cell and 8-cell stages (adjusted P-value < 0.05 and fold change >8 or <0.125).

