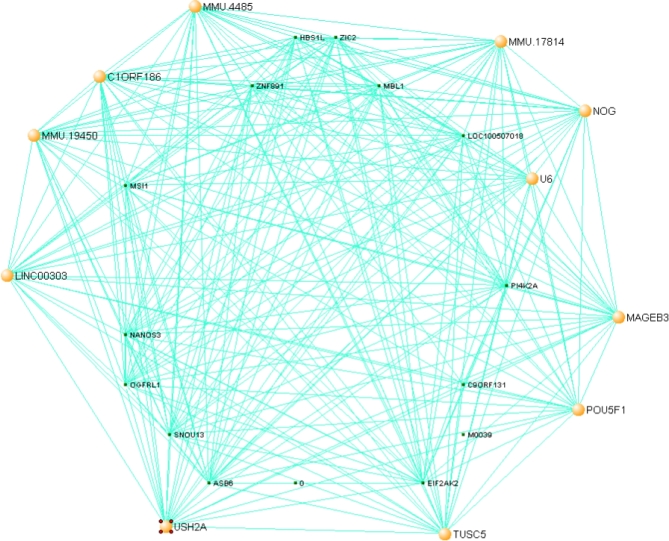
Figure 6.
Gene network visualization of a morula-specific gene expression module. VisANT was used to graph the cluster of genes most highly correlated with the morula stage (Morula_1, P = 5e-06, R = 0.91). The 30 genes with the highest connectivity within the network (kME) are charted, and hub genes within the network (kME > 0.95) are highlighted with yellow dots.

