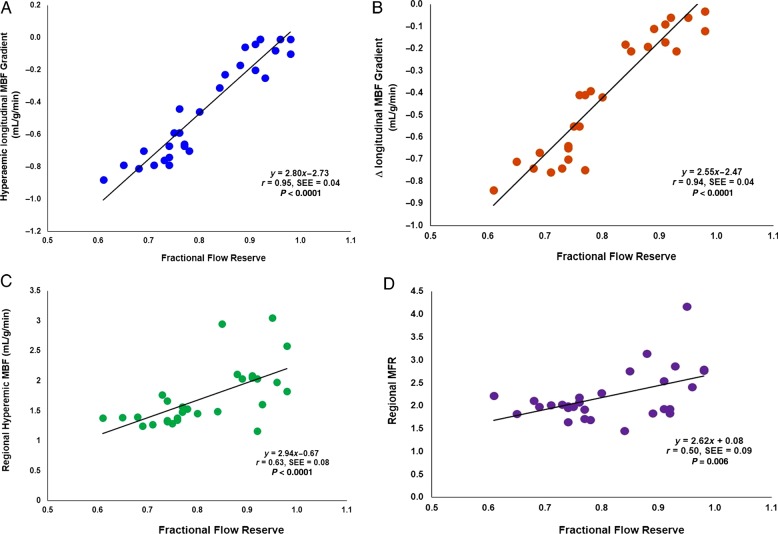
Figure 4.
Relationship among hyperaemic longitudinal MBF gradient, Δlongitudinal MBF gradient, hyperaemic MBF, MFR, and severity of invasively determined FFR. Correlation between hyperaemic longitudinal MBF gradient (A) and Δlongitudinal MBF gradient (B) with corresponding FFR, respectively (negative values on the y-axis indicate an increase in longitudinal MBF gradient). In addition, C and D display the correlation between hyperaemic MBF and MFR with the FFR, respectively. SEE, standard error of the estimate.

