Figure 2.
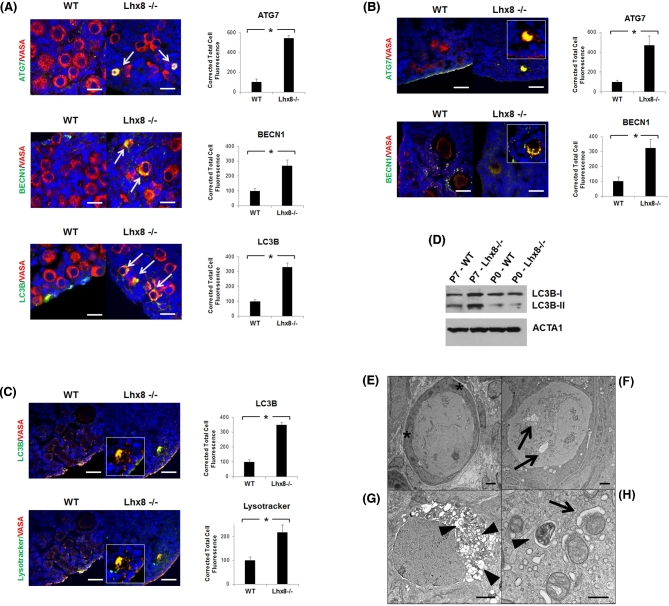
Germ cell loss results from autophagy and results in fibrotic ovaries. (A) Immunohistochemistry of P2 wild-type and Lhx8-/- ovaries for autophagy markers ATG7, BECN1, and LC3B showing first signs of autophagy activation (arrows). Cytoplasmic colocalization with VASA (red) results in yellow color, which is more evident at higher magnification. Nuclei are stained blue with DAPI. Bar = 20 μm. Quantification of fluorescence intensity for each autophagy marker is shown next to their images. Data are represented as mean values ± SEM. (*) P < 0.05. (B and C) Immunohistochemistry at P7 showed that the few remaining oocytes in Lhx8-/- ovaries were positive for the markers of autophagy. Quantification of fluorescence intensity for each autophagy marker is shown next to their images. Data are represented as mean values ± SEM. (*) P < 0.05. (C) Lysotracker, a stain for lysosomes, colocalized with LC3B and identified autolysosomes. VASA was used as an oocyte marker. Nuclei are stained blue with DAPI. Bar = 40 μm. Quantification of fluorescence intensity for LC3B and Lysotracker is shown next to their images. Data are represented as mean values ± SEM. (*) P < 0.05. (D) Western blot confirming an increased conversion of LC3B into the shorter LC3B-II form, associated with autophagy, in P7 Lhx8-/- ovaries compared to wild type. Actin was used as loading control. (E) Electron microscopy of P7 wild-type ovary shown as reference. Asterisks mark two of the flat granulosa cells surrounding the oocyte. (F-H) Electron microscopy of P7 Lhx8-/- ovary sections. Oocytes presenting several degrees of autophagy, ranging from a few autophagic vacuoles (F, arrows) to cytoplasm completely filled with autolysosomes (G, arrowheads). Bar = 2 μm. (H) Autophagy involving mitochondria, showing a mitochondrion in the early phase of engulfment by a nascent autophagosome (arrow), and another being digested in an autolysosome (arrowhead). Bar = 500 nm.

