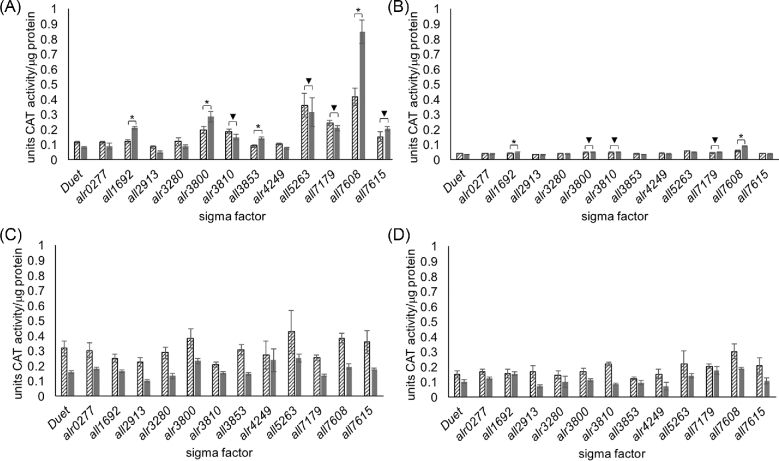
Figure 2.
CAT activity measured from (A) PltxA-cat (pPJAV562), (B) PbarA-cat (pPJAV575), (C) PcurA-cat (pPJAV576) and (D) PpatA-cat (pPJAV578) with either the empty expression vector pCOLADuet-1 or pCOLADuet-1 containing the indicated sigma factor. CAT activity was determined by comparison to a standard curve made with purified CAT, per μg of protein ± standard deviation. The lined bars indicate the uninduced samples while the grey bars indicate the induced sample. (*P < 0.0001 for increased expression in induced samples over uninduced; ▾P < 0.0001 for increased expression of induced sigma factor over induced pCOLADuet-1, but no significant difference between uninduced and induced sample). The data presented here are the aggregate of three biological replicates assayed in technical duplicate.

