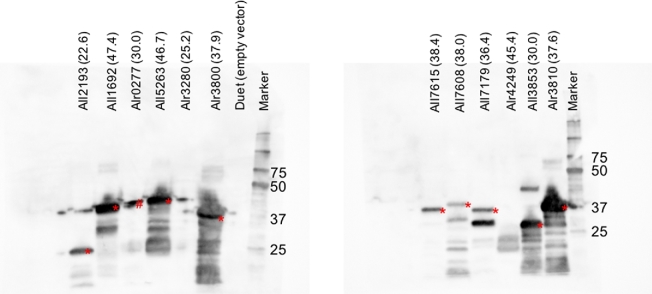
Figure 3.
Western blots of Anabaena sigma factors expressed from pCOLADuet-1 at 28°C in the soluble fraction of E. coli BAP1 cell lysate. The name of the sigma factor expressed is listed above each lane and the number in parentheses indicates the calculated molecular weight for each protein in kDa. Expected bands are denoted by an red asterisk (*). The bands denoted by a red pound sign (#) are due to overflow from the neighboring lane. The numbers to the right of the lane labeled ‘Marker’ indicate the size of the Precision Prestained Protein Ladder (Bio-Rad) in kDa. The data presented here are from one representative experiment.

