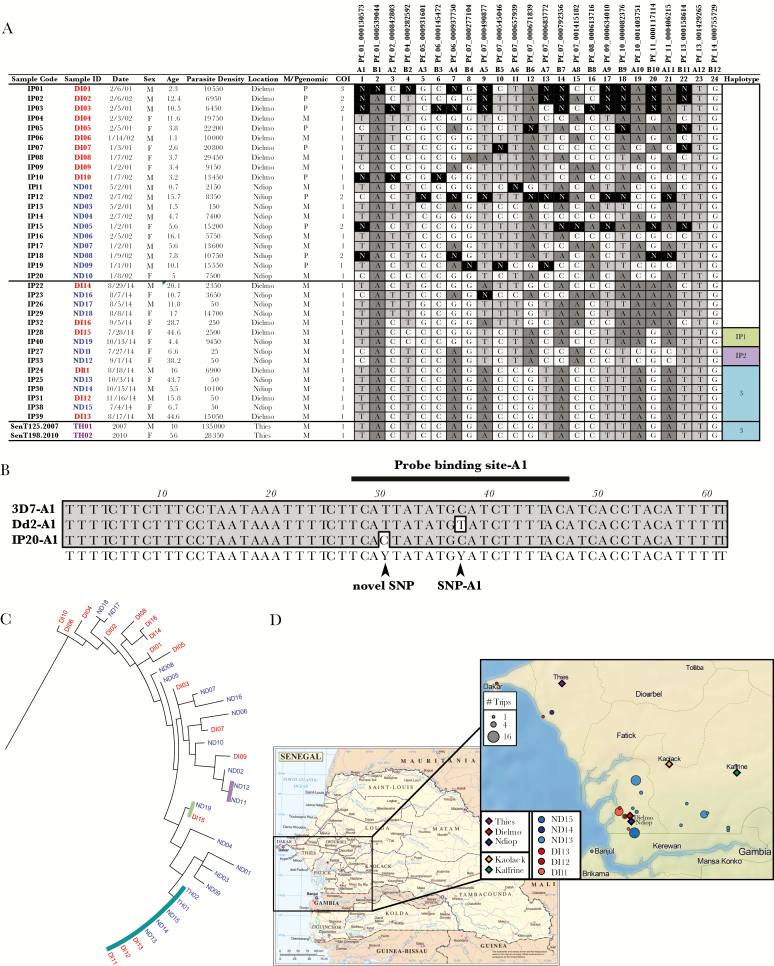
Figure 1.
Molecular barcode diversity from Dielmo and Ndiop, Senegal. A, Barcodes from samples included in this study. Blinded sample codes, Patient parameters are shown including sample ID (color coded per region of collection), date of collection, sex, age, parasite density /µL, and collection location. Single-nucleotide polymorphism (SNP) calls are shown for each of 24 markers and a call of “N” represents a mixed-allele call. M/P genomic indicates monogenomic or polygenomic infections, based on number of Ns; ≥2 represents a polygenomic infection. Based on the barcodes, complexity of infection (COI) is also shown as estimated by the COIL algorithm. Common genetic signature (CGS) cluster haplotypes are listed and colored on the far right. B, Polymerase chain reaction (PCR) sequencing for marker A1 reveals a novel polymorphism in the probe-binding region for sample IP20. PCR sequencing to confirm SNP assay A1 call was performed with the same primers used for the high-resolution melting amplicon: A1 F: 5ʹ-AGCAATCGAACCCTTTGATCTA-3ʹ; A1 R: 5ʹ- AATGAGAAGAGAGAAATATGTGTTGATAA- 3ʹ and the same PCR conditions, as described previously [7]. PCR products from sample and controls (3D7 and Dd2) were run on a gel to confirm size and purity and were sequenced by Sanger sequencing in both forward and reverse directions using the same primers. Contiguous sequences were generated and alignments were performed using MacVector (version 12.7.3). C, Neighbor-joining phylogenetic tree of molecular barcodes using the Jukes–Cantor method. Sample names at the branch ends are colored per sample location. CGS haplotype clusters are indicated by colored bars. D, Map of sample locations and travel history for individuals with the haplotype 3 parasite genotype. Base map of Senegal (left) is based on United Nations map of Senegal (map number 4174, revision 3, January 2004); zoomed in panel (right) was created with TileMill Version 0.10.1 (MapBox) with terrain data from Natural Earth. Legend indicates major cities and villages of interest (diamonds: Dielmo, Ndiop, Thiès, Kaolack, Kaffrine), and color-coded travel histories for the 6 individuals with the haplotype 3 parasite genotype. The size of the circle indicates the number of trips to each location.

