Figure 1.
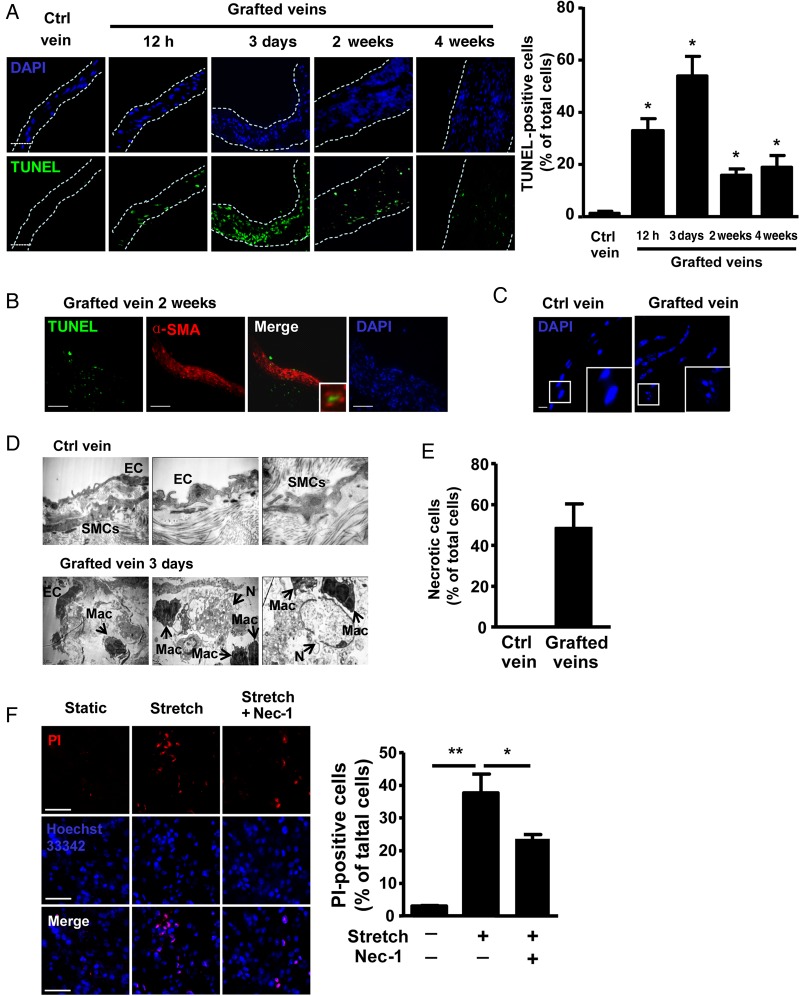
Necrosis of SMCs in vein grafts of mice. (A) TUNEL staining and quantification of control (Ctrl) veins and vein grafts at the indicated times. Nuclei were stained with DAPI. Dotted lines indicate the cross-section of vein grafts; n = 6 per group. Scale bar: 50 µm. (B) IF staining of α-SMA (TRITC) in vein grafts at 2 weeks; n = 6 per group. Scale bar: 50 µm. (C) Frozen sections from control veins and vein grafts at 12 h were stained with DAPI. Scale bar: 5 µm; n = 6 per group. (D) EM of control vein and vein grafts at 3 days; n = 6 per group. (E) Qualification of necrotic SMCs in grafted veins at 3 days. Data represent the mean ± SEM; n = 6 per group. (F) PI staining of necrosis in SMCs cultured on 3D peptide gel and subjected to mechanical stretch (15% elongation, 12 h), with or without 30 µM Nec-1 pre-treatment and quantification. Data represent the mean ± SEM; five independent experiments were performed. *P < 0.05, **P < 0.01.

