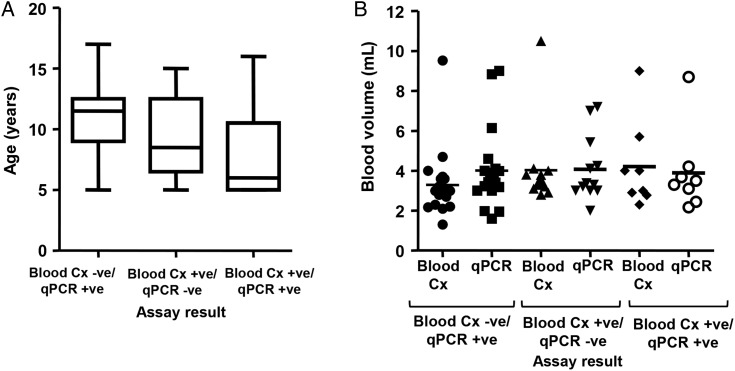
Figure 3.
Age (A) and volume of blood tested (B) of specimens that were blood culture negative and real-time polymerase chain reaction (qPCR) positive; blood culture positive and qPCR negative; and positive for both blood culture and qPCR. Age data are expressed as a box-and-whisker plot with whiskers representing the minimum and maximum value. Blood volumes are expressed as a scatter plot with the bar indicating the mean. Abbreviations: -ve, negative; +ve, positive; Cx, culture.

