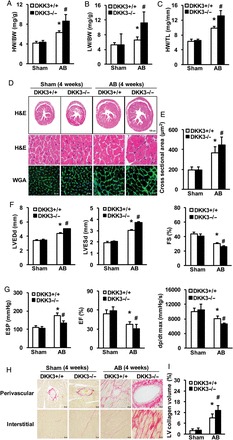
Figure 3.

Loss of DKK3 exacerbates pressure overload-induced hypertrophy. (A–C) Statistical results for the following ratios in the indicated groups (n = 12–13 mice per experimental group): (A) HW/body weight (BW); (B) LW/BW; and (C) HW/TL. (D) Images of heart sections from WT and KO mice at 4 weeks after sham or AB surgery (n = 5–8 mice per experimental group) that have been stained with H&E or FITC-conjugated wheat germ agglutinin (WGA). (E) Statistical results for cross-sectional area (CSA) (n = 100+ cells per experimental group). (F) Parameters of the echocardiographic results for WT and KO mice (n = 7–8 mice per experimental group). (G) Parameters of haemodynamic measurement results for WT and KO mice (n = 7–8 mice per experimental group). (H) Images of picrosirius red (PSR)-stained heart sections from WT and KO mice at 4 weeks after sham or AB surgery (n = 5–8 mice per experimental group). (I) Statistical results for left ventricle (LV) collagen volume (%) (n = 25+ fields per experimental group). *P < 0.05 vs. WT/sham; #P < 0.05 vs. WT/AB.
