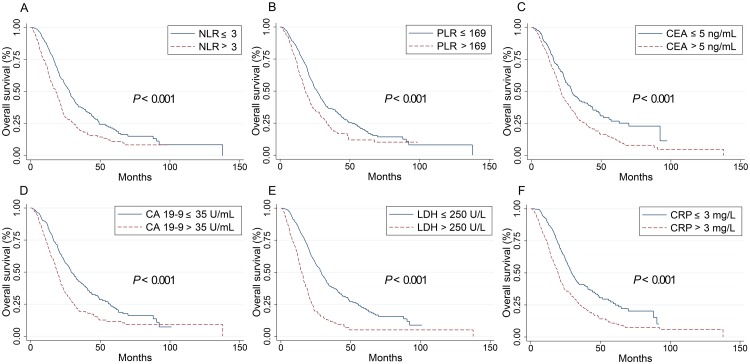
Fig 1. Kaplan–Meier curves for overall survival stratified by inflammation-based markers in all patients.
Kaplan–Meier curves for overall survival stratified by NLR levels (A), PLR (B), CEA levels (C), CA 19–9 levels (D), LDH levels (E) and CRP levels (F). PLR: the platelet-lymphocyte ratio; NLR, the neutrophil-to-lymphocyte ratio; CEA, carcinoembryonic antigen; CA 19–9, carbohydrate antigen 19–9; LDH, lactate dehydrogenase; CRP, C-reactive protein.

