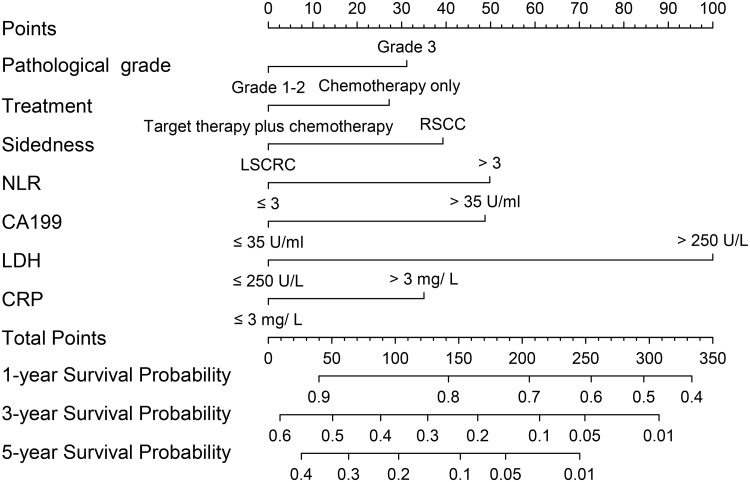
Fig 4. Nomogram model for all ACRC patients, including pathological grade, treatment, sidedness, NLR levels, LDH levels, CRP levels and CA 19–9 levels for 1-, 3- and 5-year OS.
The user can obtain the probability of 1-, 3- and 5-year OS corresponding to a patient’s combination of covariates from the nomogram. As an example, locate the patient’s pathological grade and draw a straight line upward to the “Points” axis to determine the score related to that pathological grade. Repeat the process for each variable, sum the scores achieved for each covariate, and locate this sum on the “Total Points” axis. Draw a straight line down to determine the likelihood of the 1-, 3- and 5-year survival. ACRC, advanced colorectal cancer; OS, overall survival; NLR, the neutrophil-to-lymphocyte ratio; CA 19–9, carbohydrate antigen 19–9; LDH, lactate dehydrogenase; CRP, C-reactive protein.

