
Figure 1. Overview of miRNA counts vs. patient frequency for over- and under-expressed miRNAs with original FC > 2 of FC < 0.5 in at least eight cancer types from paired data.
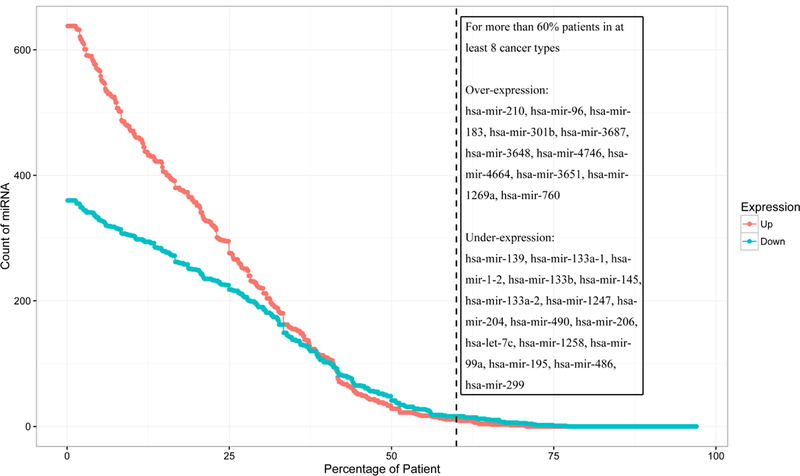
FC is used to distinguish the overall expression trend of miRNAs (by comparing FC values from tumor and non-tumor samples from the same patient). Each dot on the red line represents the count of over-expressed miRNAs per patient frequency, and dots on the blue line represent counts of under-expressed miRNAs. Across more than 35% of patients, the numbers of miRNAs with over- and under-expression are similar to each other. 11 over-expressed miRNAs and 16 under-expressed miRNAs appear in more than 60% of patients for at least eight cancer types: these miRNAs are listed in the text box. These miRNAs in multiple cancer types suggest their potential roles in the development of these cancers.