
Figure 1. mTORC1 association with the lysosome is transient and involves a minor fraction of the total cellular pool.
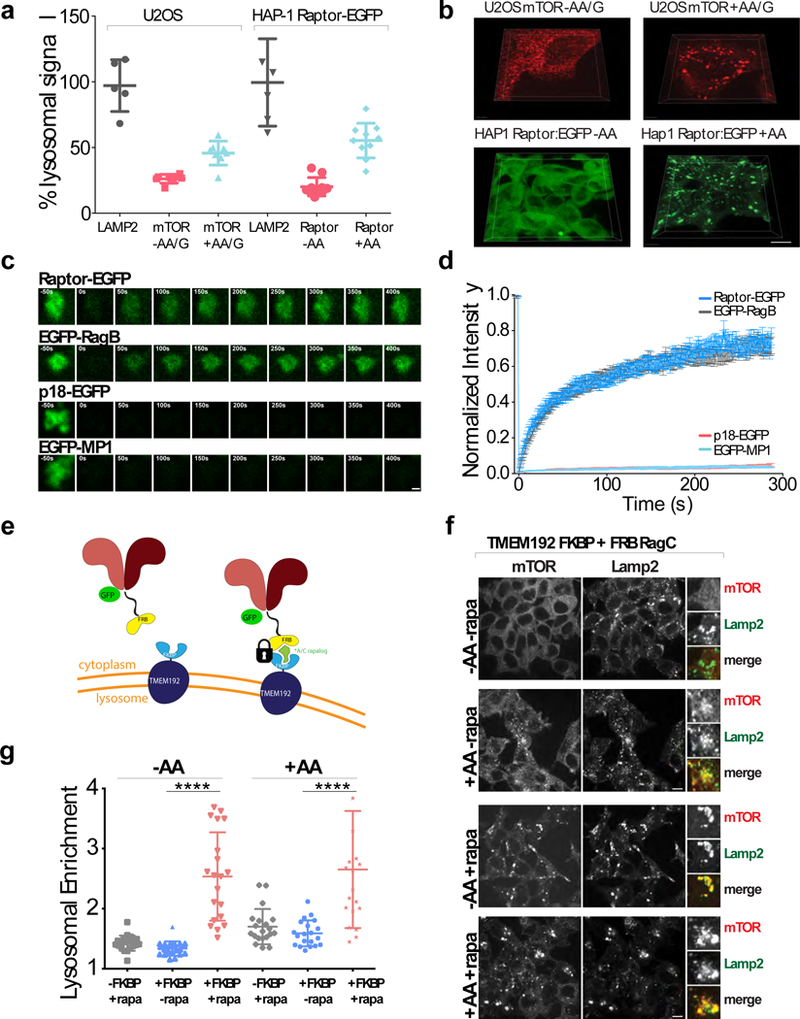
(a)Quantitation of lysosome-localized mTOR or Raptor:EGFP from U2OS or genome edited HAP-1 Raptor:GFP cells, respectively. U2OS cells were starved for amino acids and glucose (-AA/G) or starved and restimulated (+AA/G), and HAP-1 Raptor:EGFP cells were starved for amino acids (-AA) or starved and restimulated (+AA) followed by 3-D volumetric analysis of z-stacks. (average ± Standard Deviation (SD), [U2OS Lamp2 N=5, U2OS mTOR-AA/G N=7, U2OS mTOR +AA/G N=9, Hap1 LAMP2 N=6, Hap1 Raptor-EGFP -AA/G N=10, Hap1 Raptor-EGFP +AA/G N=10] fields of cells respectively. (b) (Top) Representative 3D images of U2OS cells analyzed as in (a). (Bottom) Representative 3D images of HAP-1 Raptor:EGFP cells analyzed as in (a). Scale bar 10 μm. Experiment performed 1 time. (c) Time-lapse of Fluorescence Recovery After Photobleaching (FRAP) of single lysosomes in U2OS cells expressing the indicated EGFP-tagged mTORC1, Rag GTPase and Ragulator subunits. Scale bar 1 μm. (d) Fluorescence over time curves from FRAP experiments in U2OS cells expressing the indicated constructs. Each curve is the average ± S.E.M. of [Raptor-EGFP N=21, EGFP-RagB N=14, p18-EGFP N=21, EGFP-MP1 N=24] lysosomes. (e) Schematic of in vivo induced dimerization assay for locking Rags to the lysosomal surface via rapalogue-mediated FRB/FKBP induced dimerization to the TMEM192 lysosomal resident protein. (f) Immunofluorescence images of 293T cells expressing the indicated constructs that have been starved of amino acids for 1 hour (‘-AA’) or starved for 50 minutes then restimulated with amino acids for 10 minutes (‘+AA’). For conditions treated with 50 nM rapalogue (rapa), the drug was added for 20 minutes prior to starvation and was maintained in the media throughout starvation. Scale bar 10 μm. (g) Quantitation of mTOR Lysosomal Enrichment Score for immunofluorescence images in (f) (mean ± S.D., N=20 cells for all conditions, **** p<0.0001, two-sided unpaired t-test). See Supplementary Table 1 for statistics source data.