
Figure 2. The Rag GTPases cycle between the lysosome and the cytoplasm in a nutrient-controlled manner.
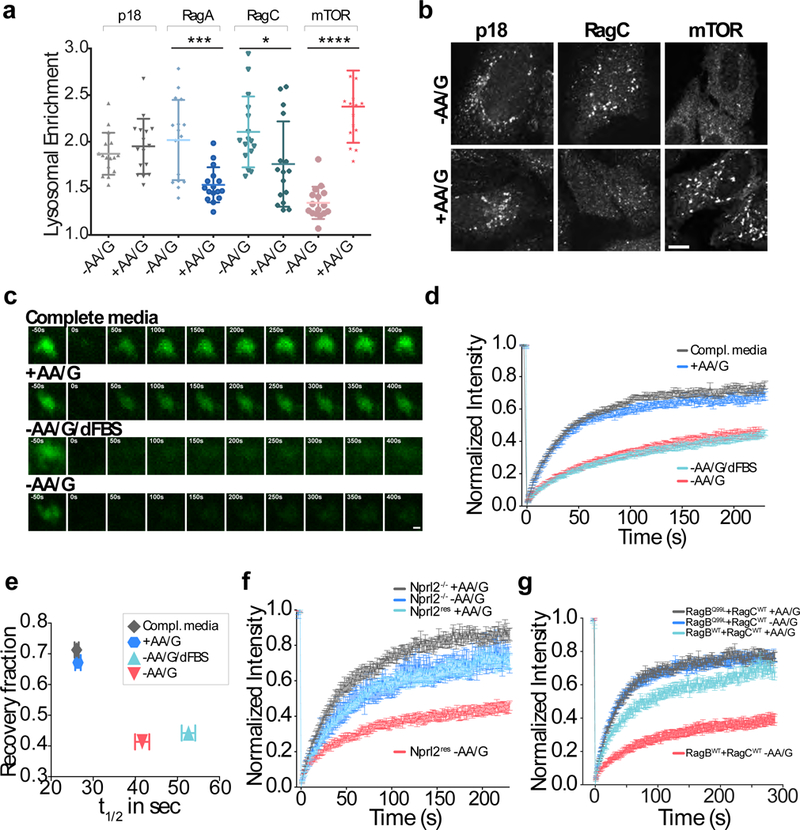
(a)Quantitation of Lysosomal Enrichment Score for p18, RagA, RagC and mTOR based on endogenous LAMP2 staining in U2OS cells that were starved for amino acids and glucose for 2h (‘-AA/G’), or starved for 1.5h and restimulated for amino acids and glucose for 30 min (‘+AA/G’) (mean ± S.D., N =16 cells/condition, *** p=0.0003, * p=0.0274, **** p<0.0001, two-sided unpaired t-tests). (b) Representative immunofluorescence images analyzed in (a). Scale bar 10 μm. (c) FRAP time-lapse of single lysosomes in U2OS cells expressing GFP-RagB + FLAG-RagC and subjected to the indicated nutrient conditions. “Compl. Media” indicates that cells were kept continuously in complete media, whereas “+AA/G” cells were starved of amino acids and glucose for 1.5hr then restimulated with amino acids and glucose for 30 min. “-AA/G/dFBS” indicates that cells were deprived of dialyzed FBS during starvation whereas -AA/G were starved in the presence of dialyzed FBS. Scale bar 1 μm. (d) Fluorescence over time curves from FRAP experiments in (c). Each curve is the average ± S.E.M. of [Compl. media N=30, +AA/G N=24, -AA/G/dFBS N=28, -AA/G N=27] lysosomes. (e) Plot showing inverse correlation between recovery fraction and halftime (t1/2) from the curves in (d). Shown are best fit values with 95% confidence intervals. (f) Fluorescence over time curves from FRAP experiments on SW780 Nprl2−/− cells and SW780 Nprl2 rescue (Nprl2res) cells expressing GFP-RagB that were either starved or restimulated for amino acids and glucose. Each curve is the average ± S.E.M. of [grey N=22, dark blue N=13, light blue N=20, red N=18] lysosomes. (g) Fluorescence over time curves from FRAP experiments on U2OS cells coexpressing GFP-RagBQ99L (nucleotide hydrolysis deficient mutant) or GFP-RagBWT along with FLAG-RagC, which were either starved or restimulated for amino acids and glucose. Each curve is the average ± S.E.M. of [grey N=20, dark blue N=16, light blue N=22, red N=21] lysosomes. See Supplementary Table 1 for statistics source data.