
Figure 5. Both G-domains are required for dynamic Rag GTPase dissociation from Ragulator.
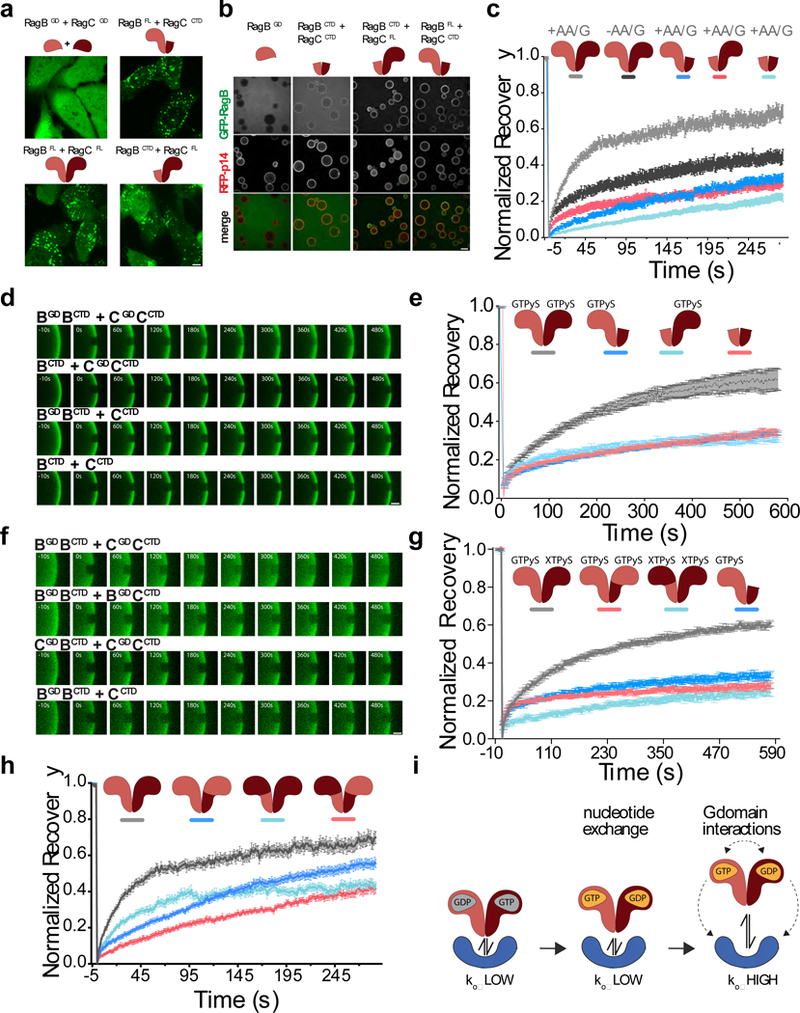
(a)Subcellular localization of the indicated full length or truncated GFP-RagB + FLAG-RagC heterodimers in U2OS cells. Scale bar 10 μm. Experiment repeated 3 times. (b) Equilibrium binding of the indicated full length or truncated GFP-RagB constructs (co-purified with full length or truncated FLAG-RagC, where indicated) to beads coated with GST- and RFP-tagged Ragulator complex. Scale bar 100 μm. Experiment repeated 2 times. (c) Both G-domains are required for dynamic Rag GTPase association to lysosomes. Fluorescence recovery over time curves for nutrient starved (-AA/G) and nutrient restimulated (+AA/G) GFP-tagged Rag GTPase heterodimers as well as indicated truncation constructs. Each curve is the average ± S.E.M. of [light grey N=30, dark grey N=27, dark blue N=24, red N=30, light blue N=30] lysosomes. (d) Two Rag G-domains are required for dynamic binding to Ragulator in vitro. FRAP time-lapse of single ROIs from Ragulator-coated beads incubated with excess GFP-tagged Rag full length and truncation constructs that were loaded with GTPγS. Scale bar 10 μm. (e) Fluorescence Recovery curves for the experiment shown in (d). Each curve is the average ± S.E.M. of [grey N=6, dark blue N=12, red N=11 light blue N=16] bead regions. (f) Chimeric Rag heterodimers containing two of the same G domains release less efficiently from Ragulator than wild-type Rag heterodimers. FRAP time-lapse of single ROIs from Ragulator-coated beads incubated with excess GFP-tagged, wild-type and chimeric Rag heterodimers that were loaded with GTPγS. Scale bar 10 μm. (g) FRAP recovery curves for the experiment shown in (f). Each curve is the average ± S.E.M. of [light grey N=12, dark blue N=12, red N=12, light blue N=14] bead regions. (h) Fluorescence recovery curves from FRAP experiments in U2OS cells expressing the indicated GFP-tagged wildtype and chimera Rag constructs. Each curve is the average ± S.E.M. of [light grey N=23, dark blue N=31, red N=19, light blue N=31] lysosomes. (i) Model displaying how, upon loading of Rag A/B with GTP, the presence of both G-domains is required to destabilize Ragulator-Rag GTPase interaction. See Supplementary Table 1 for statistical source data.