
Figure 6: Cancer-specific Rag GTPase mutants stabilize mTORC1 at the lysosome by overriding dynamic dissociation from Ragulator.
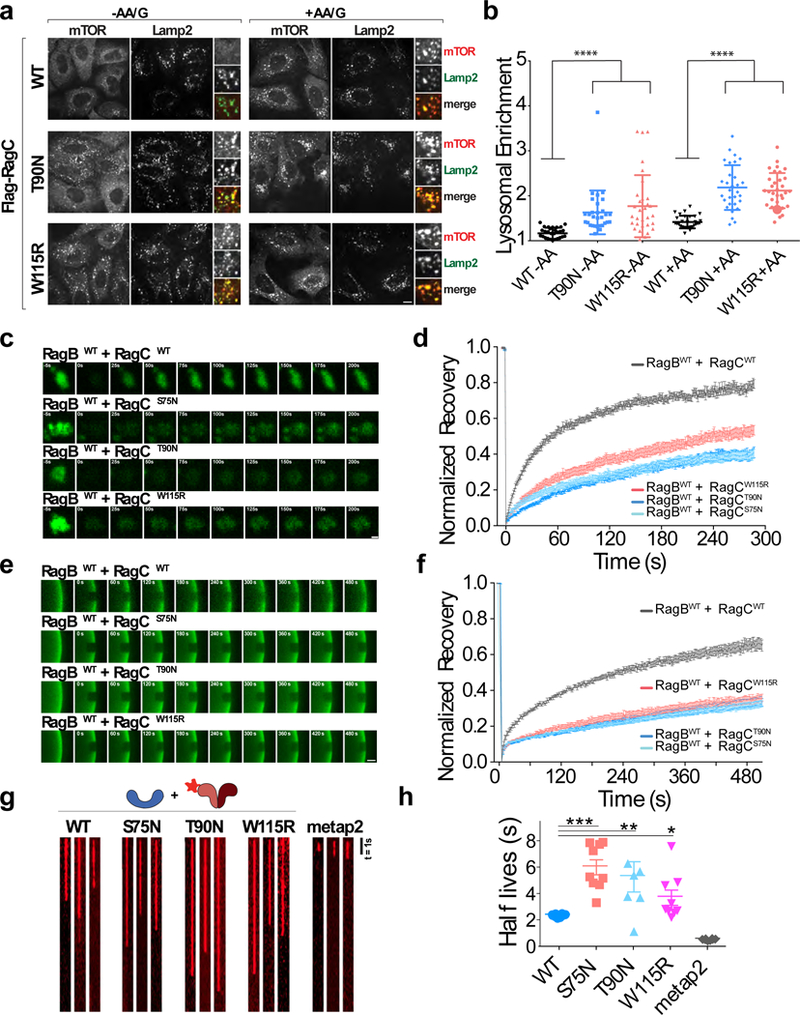
(a)Immunofluorescence images of endogenous mTOR and LAMP2 in U2OS cells stably expressing the indicated wild-type and mutant FLAG-RagC constructs and maintained for 2h in the indicated nutrient conditions. Scale bar 10 μm. (b) Quantitation of mTOR Lysosomal Enrichment Score for immunofluorescence images in (a) (mean ± S.D., [WT -AA N=30, T90N -AA N=30, W115R -AA N=32, WT +AA N=30, T90N +AA N=30, W115R +AA N=33] cells/condition, **** p<.0001, two-sided unpaired t-tests). (c) Time-lapse of fluorescence recovery after photobleaching (FRAP) of single lysosomes in U2OS cells expressing the indicated GFP-tagged Rag GTPase heterodimer containing the indicated RagC mutation. Scale bar 1 μm. (d) Fluorescence recovery over time curves from FRAP experiments in U2OS cells expressing the indicated GFP-tagged Rag GTPase heterodimer. Each curve is the average ± S.E.M. of [WT/WT N=28, WT/S75N N=28, WT/T90N N=28, WT/W115R N=25] lysosomes. (e) FRAP time-lapse of single ROIs from Ragulator-coated beads incubated with excess GFP-tagged Rag heterodimers containing the indicated wild-type and mutant RagC constructs. Scale bar 10 μm. (f) FRAP recovery curves for the experiment shown in (e). Each curve is the average ± S.E.M. of [WT N=12, S75N N=11, T90N N=8, W115R N=12] bead regions. (g) Kymographs of single HaloTMR-RagB co-purfied with the indicated wild-type and mutant FLAG-RagC constructs, binding to Ragulator-coated or to Metap2-coated beads. Scale bar 1s. Experiment repeated 3 times. (h) Photobleach-corrected half-life (t1/2) values for the residence time of the indicated HaloTMR-RagB + FLAG-RagC constructs on Ragulator beads. Metap2 is included as negative control. Single molecule residence time data from three biological replicates were pooled and divided into 10 randomly determined sets. Half-lives were calculated from single exponential fits of each set. Displayed is mean ± S.E.M., for [WT N=10, S75N N=9 T90N N=7, W115R N=9, MetaP2 N=10] calculated half-lives, **** p<0.0001, ** p=0.0074; *p=0.0238, two-sided unpaired t-tests. See Supplementary Table 1 for statistical source data.