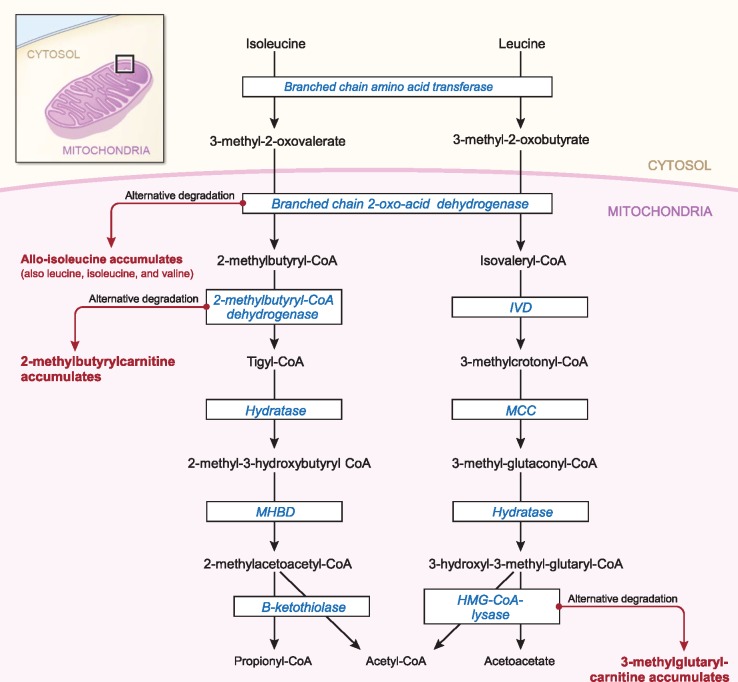
Figure 2.
Pathways of isoleucine and leucine catabolism. Isoleucine and leucine catabolism is shown by arrows, with the enzymes catalyzing the reactions shown inside boxes. Straight arrows indicate normal catabolism, whereas side (bent) arrows indicate the byproducts that accumulate when enzyme activity is insufficient to convert available substrates. Each metabolite at the end of side (bent) arrows was associated with breast cancer risk (either overall or ER+). Figure is adapted from Knerr, Vockley, and Gibson (28). IVD = Isovaleryl-CoA dehydrogenase; MCC = Methylcrotonyl-CoA carboxylase; MHBD = 2-methyl-3-hydroxybutyryl-CoA dehydrogenase.

