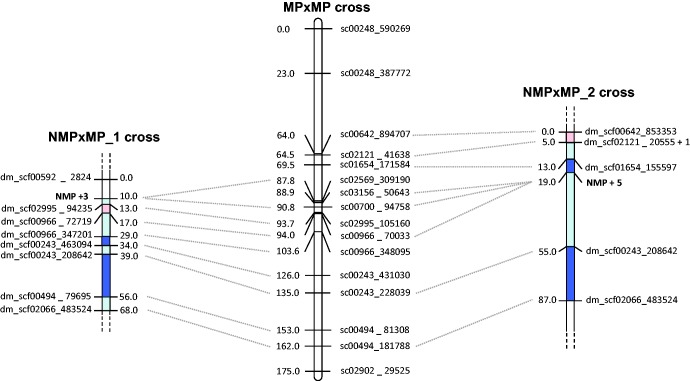
Fig. 1.
Genetic map of the two NMP × MP crosses (microsatellite markers) and of the MPxMP cross used to create the Daphnia magna reference genetic map (SNP markers, Dukič et al. in revision). Only Linkage Group 3 (LG3) is shown. Map distances are in centiMorgans, calculated with the Kosambi mapping function in R/qtl. Areas in light blue/light red show a nonsignificant reduction/expansion of recombination by comparison to the MP cross whereas areas in bright blue indicates a significant reduction of recombination. For the two NMP×MP crosses, one marker per position is represented. In NMPxMP_1, NMP + 3 indicates that three markers were in full linkage with the NMP locus. In NMP×MP_2, dm_scf00532_1398 was fully linked with dm_scf02121_20555; also, NMP + 5 indicates that five markers were fully linked with the NMP locus.

