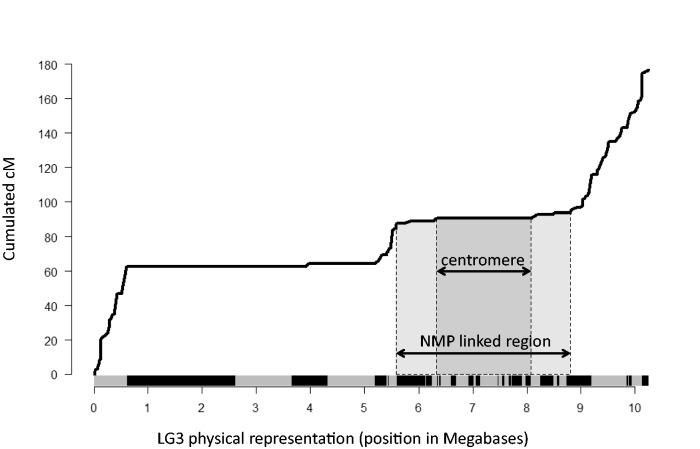
Fig. 2.
Marey map of LG3 in the MP × MP cross, showing the evolution of the recombination rate along the physical position on LG3. The x axis shows the position in Megabases. Alternated grey and black color bar on the x axis represents the length of the different scaffolds that compose LG3. The light grey shaded area corresponds to the genomic region containing markers fully linked with the NMP phenotype (from 5.58 to 8.81 Mb). This linked region encompasses the centromere, represented by the dark grey shaded area (from 6.32 to 8.08 Mb).

