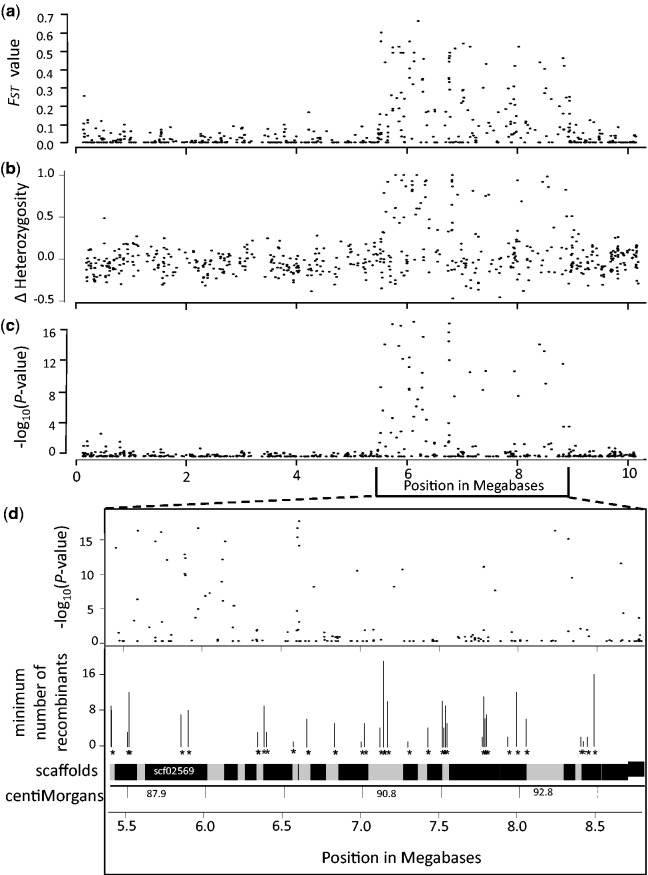
Fig. 4.
Subdivision between NMP and MP individuals (FST values, in panel a), the difference in heterozygote frequencies (panel b), and log-transformed P-values for associations on LG3 (panel c). Panel (d), for the NMP and flanking regions, shows the associations and the minimum numbers of recombinant haplotypes at different positions represented as both the genetic map locations in centiMorgans, and the physical positions of scaffolds.

