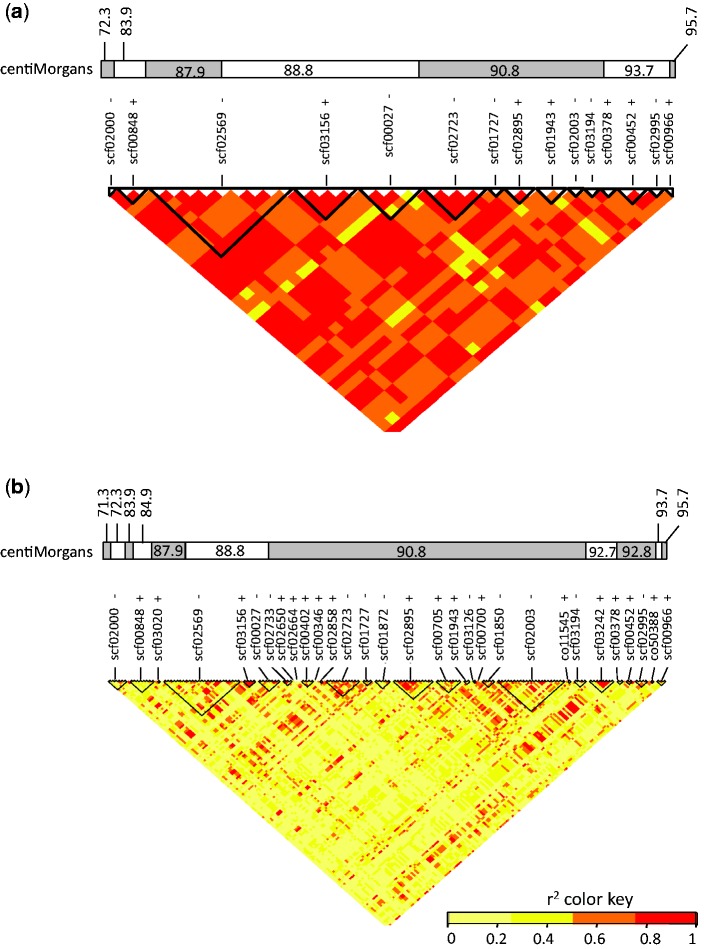
Fig. 5.
Linkage Disequilibrium Heatmap (r2 coefficients) in the NMP region. Results are shown for (a) the NMP associated SNPs, (b) all SNPs mapping to the NMP and flanking region corresponding to the NMP region using the 72 individuals (55 MP and 17 NMP). Black triangles represent scaffolds, and the bi-colored band represents the genetic map positions of each SNP, in centiMorgans. + and − represent the orientations of the scaffolds (forward and reverse respectively.

