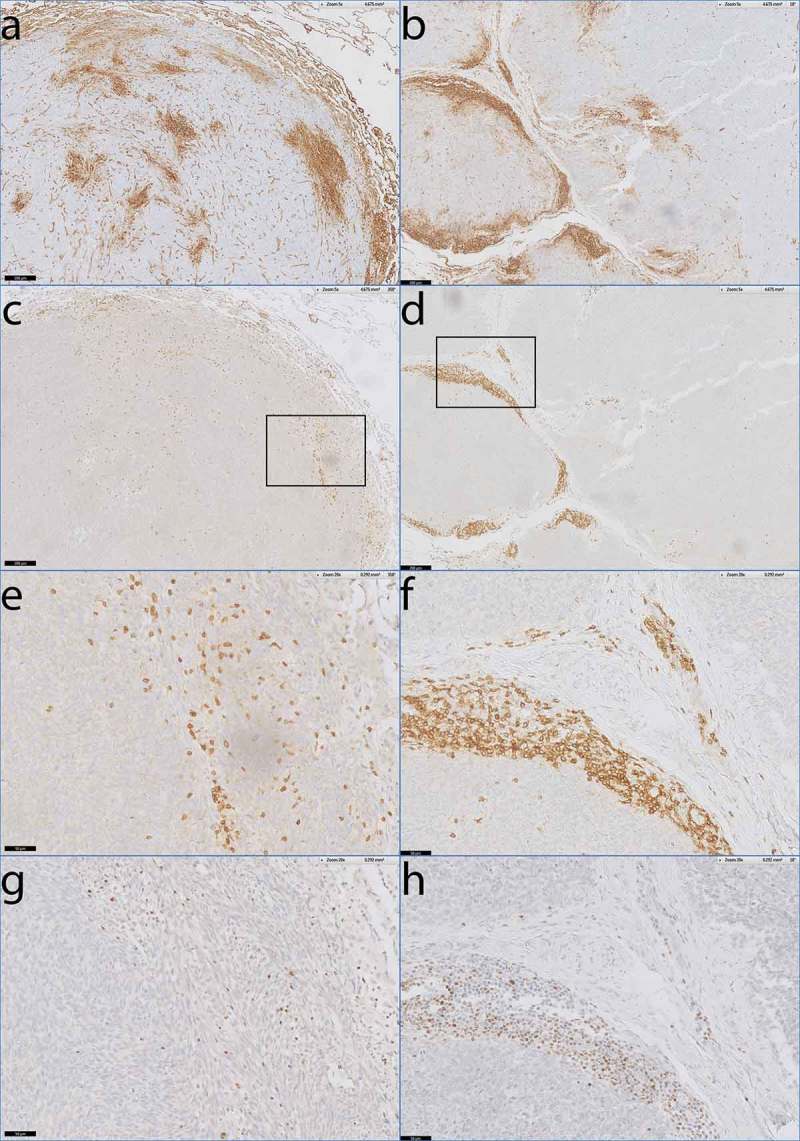
Figure 5.

Co-localisation of activated T-cells and HLA-I expression in monophasic and biphasic SS.
Digitally overlaid slides of consecutive sections that were stained with antibodies specific for HLA-I, CD3, and T-bet. a) Heterogeneous staining of HLA-A in monophasic SS07. b) Heterogeneous staining of HLA-B/C in biphasic SS45. c-d) consecutive slide after a and b demonstrating dense T-cell infiltration by anti-CD3 staining in areas of elevated HLA-I expression. e-f) Magnification of c and d. g) consecutive slide after e, demonstrating T-bet positivity of densely infiltrated T-cells. h) consecutive slide after f demonstrating T-bet positivity of densely infiltrated T-cells as well.Scale bars: a-d: 200 µm, e-h: 50 µm.
