
Figure 2.
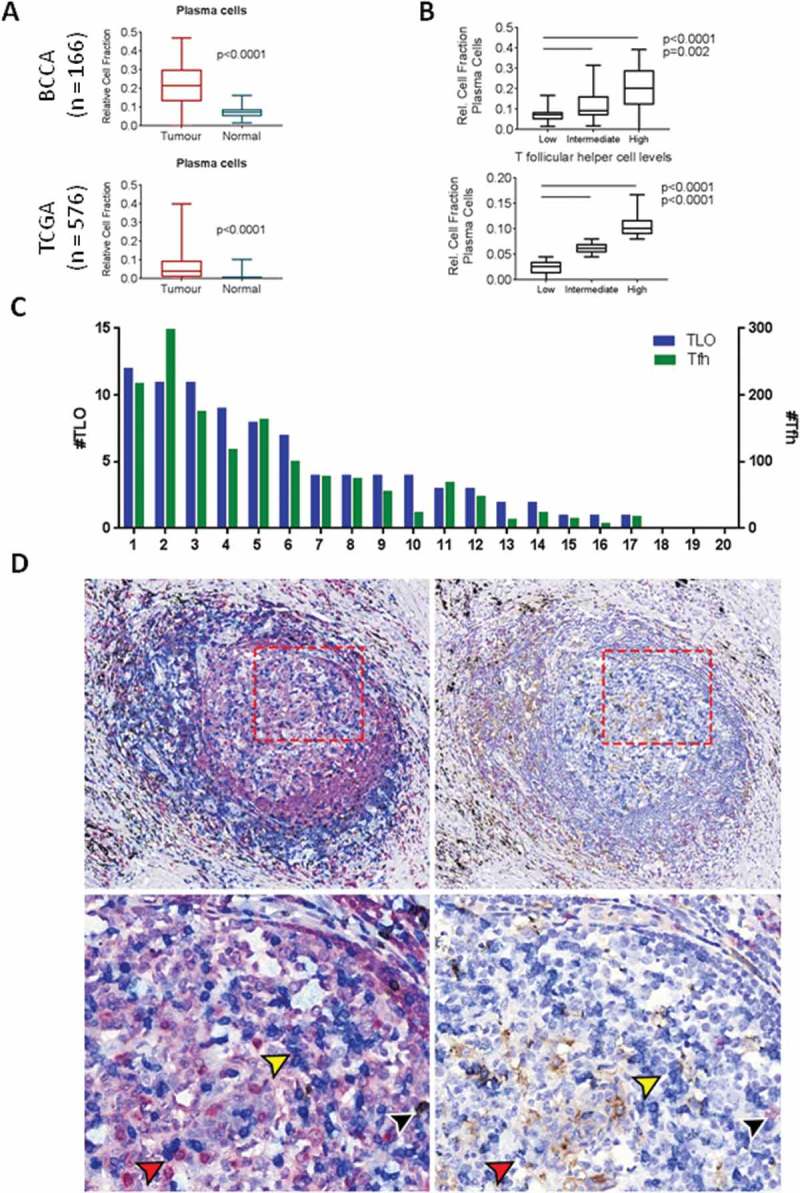
T follicular helper cells are associated with plasma cells and are present in the germinal center of tertiary lymphoid organs. A) The relative cell fraction of plasma cells in bulk expression data from BCCA (ntumour=83, nnormal=83) was compared using a paired t-test (p < 0.0001) and validated in the TCGA unpaired cohort (ntumour=517, nnormal=59, p < 0.0001). B) Relative cell fraction of plasma cells in relation to T follicular helper cell (Tfh) fraction was assessed by stratification of TCGA tumours into tertiles according to Tfh fraction. C) Quantification of tertiary lymphoid organs (blue, left Y axis) and Tfh (green, right Y axis) across 20 tumour sections from BCCA. D) Immunohistochemistry images of serial sections stained for: (left panels) CD79a (red), CD3 (blue), CD8 (brown), and counterstained with haematoxylin, and (right panels) CD8 (red), PD1 (blue), PD-L1 (brown), and counterstained with haematoxylin. Yellow arrows indicate CD3+ PD1+ cells (blue stain, both panels); black arrows indicate CD3+ CD8+ PD1+ cells (blue and brown stain (left), red stain (right); red arrows indicate areas of adjacent CD3+ and CD79a+ cells (left panel) as well as adjacent PD1+ and PD1- cells (right panel). Upper images: 10x magnification, lower images 20x magnification. All boxplots display the median value, with 25th to 75th percentile values denoted by the box and minimum and maximum values by the error bars.