Figure 6.

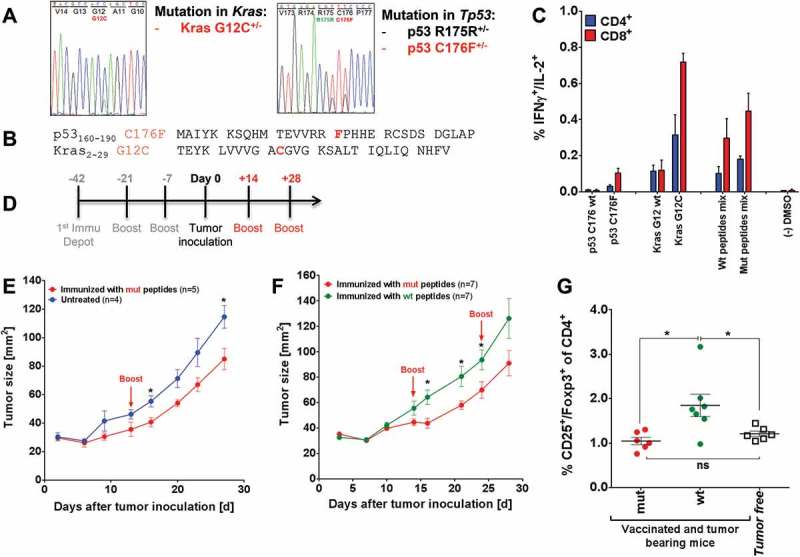
Mutated peptide vaccination induced T cell responses against intrinsic mutations in A2.DR1 dtg sarcoma and was superior to wt vaccination in controlling in vivo tumor growth (A) Sequencing histogram analysis of sarcoma cell line 39. Chromosomal DNA as well as cDNA of line 39 were used as templates for amplification with gene specific primers (Kras and Tp53). Amplified PCR products were analyzed by Sanger sequencing to detect mutations in Kras and Tp53 genes and mRNAs. (B) Amino acid sequences of the mutated peptides carrying intrinsic mutations used for vaccination. (C) Recall responses against mutated and wt peptides sequences tested in A2.DR1 dtg mice immunized with p53 R176F (mur) and Kras G12C mutated peptides (vaccination regimen: peptides in PBS-based formulations including 50 μg CpG ODN 1668 as an adjuvant, twice on a bi-weekly basis). In vitro recall responses were obtained from two-color cytokine secretion assays (IL-2, IFN-γ) with pan-T cells. Percentages of IFN-γ/IL-2 double positive CD8+ and CD4+ T cells upon in vitro recall against single wt and mutated peptides presented by CD11c+ DCs are displayed. Each peptide and control sample was tested in triplicates. Results are plotted as means of triplicate assays ± SEM. (D) Vaccination schedule for tumor challenge experiments. Depot: IFA-based formulation, Boost: boost vaccination containing CpG ODN 1668 and peptides in PBS (water-based formulation). (E) Tumor growth curves of vaccinated and untreated A2.DR1 dtg mice inoculated with sarcoma line 39. 2.5 x 10⁵ tumor cells were subcutaneously administered in 100 µl of Matrigel on the right flank of each animal at day 0. One group of A2.DR1 dtg mice (n = 5) was vaccinated prior to the challenge according to the vaccination schedule shown in Figure 5 (D) with mutated (‘mut’ group: p53 C176F, Kras G12V) peptides. Mice were boosted only once with respective water-based peptide/CpG formulation during the challenge on day 14. n: number of biological replicates; error bars: mean ± SEM. Significances per unpaired two-tailed t-test are shown. (F) Tumor growth curves of differently vaccinated A2.DR1 dtg mice inoculated with sarcoma line 39. 2.5 x 10⁵ tumor cells were subcutaneously administered in 100 µl of Matrigel on the right flank of each animal at day 0. Two groups of 7 A2.DR1 dtg mice each (n = 7), have been vaccinated prior to the challenge according to the vaccination schedule shown in (D) with either mutated (‘mut’ group: p53 C176F, Kras G12V) or wt (‘wt’ group: p53 C176 wt, Kras G12 wt) peptides. Mice were boosted twice with respective water-based peptide/CpG formulations during the challenge. n: number of biological replicates; error bars, mean ± SEM. (G) Number of splenic Treg cells of differentially vaccinated, tumor bearing mice of the experiment shown in (E) compared to non-tumor bearing mice on the day of sacrifice. Treg cells were stained for in whole splenocyte suspensions with fluorescent-labeled mAbs as CD4+CD3+CD25+Foxp3+ living cells in FACS. Significance per unpaired two-tailed t-test are shown. vac: vaccinated, mut: mutated.
