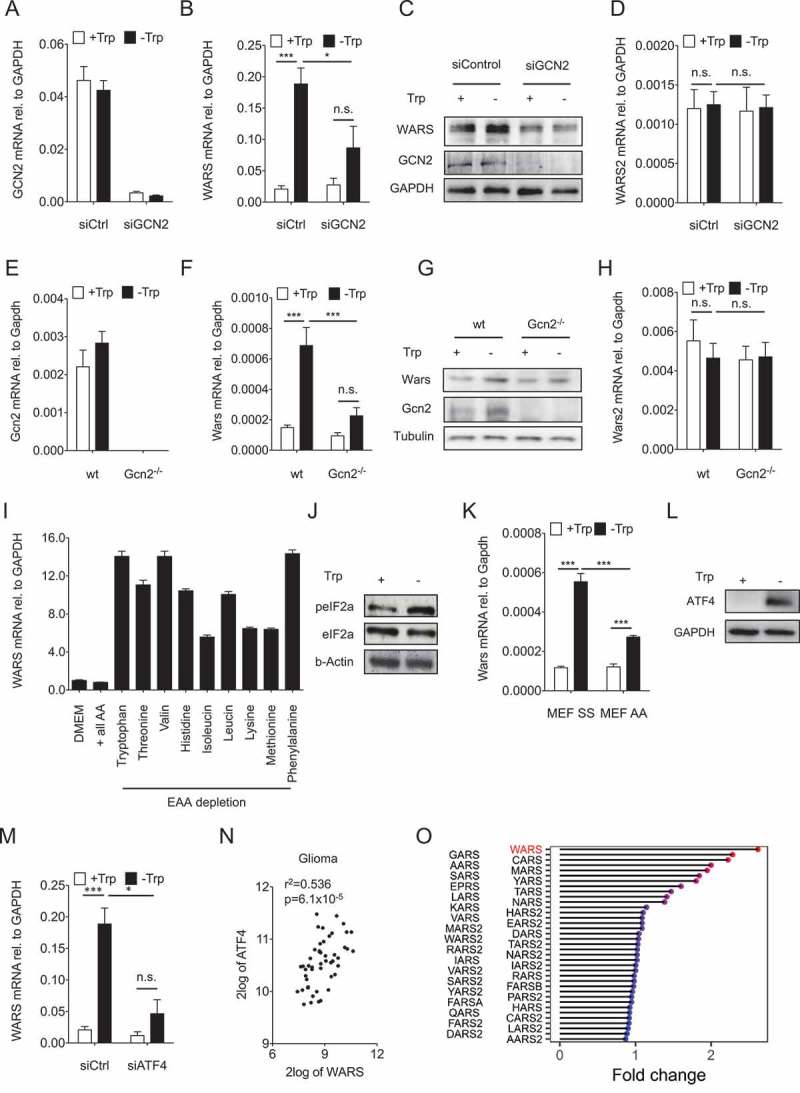
Figure 4.

GCN2-peIF2a-ATF4 signaling mediates the upregulation of WARS in response to Trp depletion.
(A) GCN2 mRNA expression measured by qRT-PCR in LN229 cells after knockdown of GCN2 by siRNA cultured in the absence and presence of 78 µM Trp for 24 h. (B) WARS mRNA expression measured by qRT-PCR and (C) WARS and GCN2 protein expression detected by Western blot under the conditions described in (A). GAPDH served as loading control. (D) WARS2 mRNA expression measured by qRT-PCR under the conditions described in (A). (E) Gcn2 mRNA expression in wildtype (wt) and Gcn2 −/- MEFs cultured in the absence and presence of 78 µM Trp for 24 h. (F) Wars mRNA expression measured by qRT-PCR and (G) WARS and GCN2 protein expression detected by Western blot under the conditions described in (E). Tubulin served as loading control. (H) Wars2 mRNA expression measured by qRT-PCR under the conditions described in (E). (I) WARS mRNA expression measured by qRT-PCR in full DMEM medium (DMEM), in amino acid-free DMEM supplemented with all amino acids (+ all AA) and in amino acid-free DMEM supplemented with all but each of the essential amino acids (EAA). (J) peIF2a and eIF2a detected by Western blot in LN229 cells cultured in the presence (+) or absence (-) of 78 µM Trp for 24 h. (K) Wars mRNA expression measured by qRT-PCR in MEFs that express wildtype Eif2a (SS) or an Eif2a version, in which serine 51 is mutated to an alanine and cannot be phosphorylated by Gcn2 (AA). MEFs were cultured for 24 h in the presence or absence of 78 µM Trp. (L) ATF4 protein detected by Western blot in LN229 cells cultured for 24 h in the presence or absence of 78 µM Trp. GAPDH served as loading control. (M) WARS mRNA expression measured by qRT-PCR in LN229 cells after knockdown of ATF4 by siRNA cultured in the absence and presence of 78 µM Trp for 24 h. (N) Correlation between ATF4 and WARS expression in human glioma (n = 50, Spearman’s rank correlation). All data are expressed as mean ± s.e.m. Statistical significance is assumed at P < 0.05 (*P < 0.05, **P < 0.01, ***P <0.001). (O) Lolli-plot showing the absolute fold changes of all the tRNA synthetases in a microarray of U87-MG cells upon 24 h of Trp starvation.
