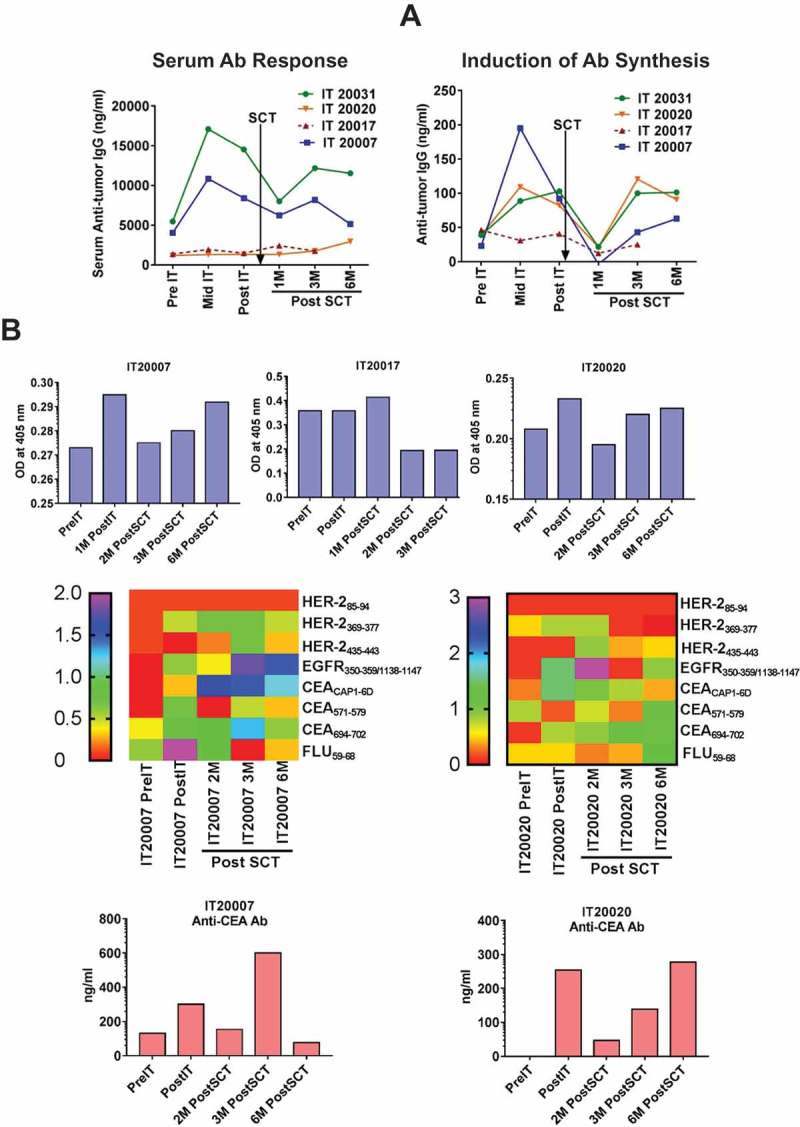
Figure 3.

The epitope-specific B-cell responses. a) Left panel shows anti-BrCa antibody levels in patient serum (n = 4). Right panel shows the anti-SK-BR-3 IgG antibody synthesis in 4 patients at pre IT, post IT and post SCT time points. The gradual increase in anti-SK-BR-3 IgG antibody synthesis after SCT indicate transfer and reconstitution of B cell responses. b) Top panel shows specific antibody titers by ELISA (1:100 dilution) in 4 patients at pre IT, post IT and multiple time points post SCT against pooled peptide. Serum antibody steadily increase up to 6M post SCT in 3 out of 4 patient serum samples indicating transfer and reconstitution of B cell responses. Middle panel shows specific serum antibody responses against indicated individual peptides by semi quantitative dot-blot assay at 1:100 dilution in two serum samples from patients IT20007 and IT 20020 at various time points. Bottom panel shows validation of dot blot assay by ELISA to quantitate anti-CEA specific antibody levels in the serum samples of IT20007 and IT 20020.
