Figure 5.
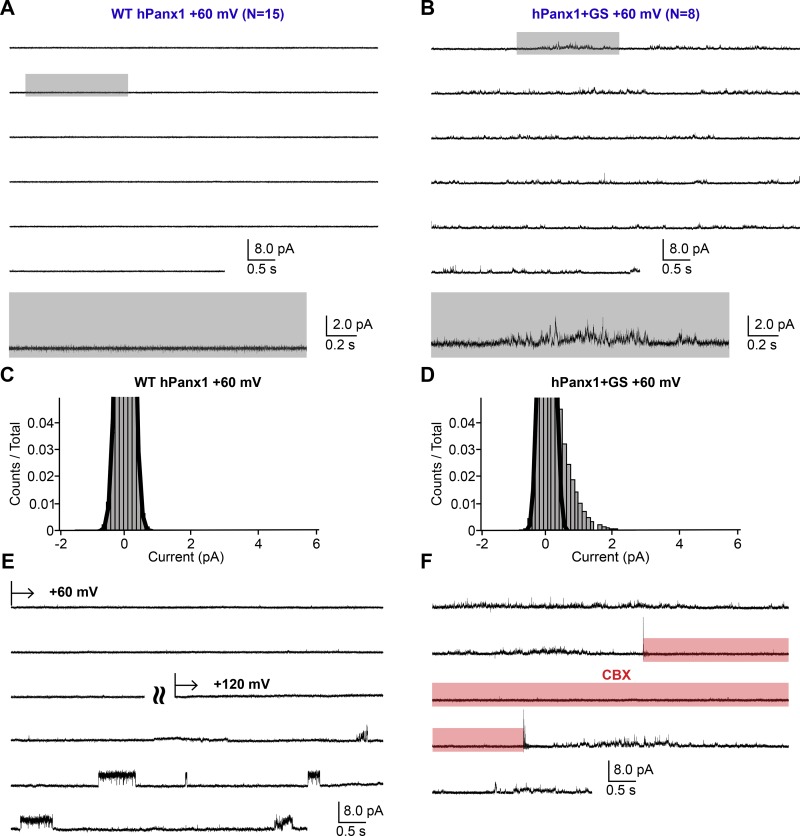
Single-channel recordings of hPanx1 at +60 mV. (A and B) Representative single-channel traces of WT hPanx1 (A; n = 15) and hPanx1+GS (B; n = 8). Outside-out patches were held at +60 mV. Highlighted gray box indicates the location of the inset underneath each respective recording. (C and D) Pooled all-amplitudes histogram generated from WT hPanx1 (C) and hPanx1+GS (D) at +60 mV. Histograms were generated from four separate recordings for each channel. Black lines represent the closed population estimated by fitting a Gaussian function. (E) Representative trace of WT hPanx1 recording confirming the existence of the channel. The patch was held at +60 mV for ∼2 min, then stepped to +120 mV. Curved lines indicate separate recording segments. (F) Representative trace of hPanx1+GS showing reversible channel activity at +60 mV. CBX (100 µM) was applied using a rapid solution exchanger for the indicated period (red box).

